Cannot download generated report for kibana 8.19.7

Hello,

I have a problem with downloading generated reports in kibana 8.19.7 with ROR 1.68.

Report is being generated successfully and I see that in “Reporting list“ app and in created index “.ds-.kibana-reporting-.kibana-X“ but when I try to download it I get redirected to kibana_address/s/default/internal/reporting/jobs/download/XXXX-XXX-XXX-XXX-XXX?elasticInternalOrigin=true

which results in

{"statusCode":404,"error":"Not Found","message":"Not Found"}

and in kibana logs I see

[WARN ][plugins.reporting] No hits resulted in search

I checked with kibana 7.17.29+ror1.68 also connected to ES 8.19.7+ror1.68 and everything is working properly but in this version “the endpoint” (when I see window where I can choose destination location for file), is

kibana_address/s/default/api/reporting/jobs/download/XXXX

Could there be any bad config on my side?

Regards,
Michał

Hello @mikeIT

Could there be any bad config on my side?

No, I don’t think it’s related to the configuration

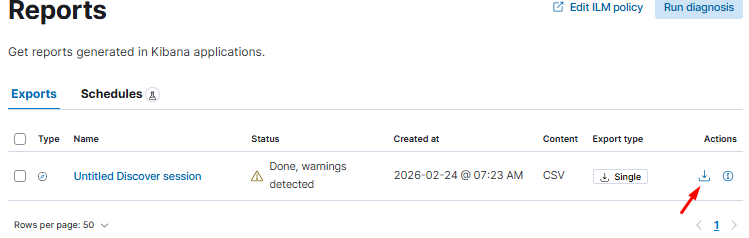
The download report action calls, search request to ES

PTH:/.kibana_admins_group/_search

Could you verify in your Access control log in the ES logs whether the Kibana index matches a user index?

[2026-02-24T05:37:32,661][INFO ][t.b.r.a.l.AccessControlListLoggingDecorator] [n1_it] ALLOWED by { name: 'ADMIN_GRP', policy: ALLOW, rules: [groups_any_of, kibana] req={ ID:7f709e55-0eb5-44da-9f80-664393409e1c-1687114729#5142, TYP:SearchRequest, CGR:admins_group, USR:admin, BRS:true, KDX:.kibana_admins_group, ACT:indices:data/read/search, OA:127.0.0.1/32, XFF:192.168.65.1, DA:127.0.0.1/32, IDX:.kibana_admins_group, MET:POST, PTH:/.kibana_admins_group/_search, CNT:<OMITTED, LENGTH=312.0 B> , HDR:x-elastic-client-meta=es=9.2.0,js=22.22.0,t=9.3.0,hc=22.22.0, user-agent=Kibana/9.3.0, x-ror-tenancy=U2FsdGVkX1+mBqSmufg9kAF5AAoWJ2vem6FcxJQOrg8ttgki0rr4weLagKLmxo+oyoBmpkhJz9rH1Zkc21H4VccMPtHgm/FP/ZM2OvlWl8pxQ/1VHuNJWqovDlZWLmPu, traceparent=00-e7f189e7befba7a3ccf807d4c9fb148e-89c35750c19b929b-00, cookie=__Host-ror.x-csrf-token-MC4wLjAuMDo1NjAx-session_id=5790f254852ee7dc6fb514e336abeacd; __Host-ror.x-csrf-token-MC4wLjAuMDo1NjAx=eaf301b13512ee4406253c3f5182a8d22456958f1331f5fc1595a95628d805bb.5649a04ec5fc727e917e08cb26ffbcc5822c5e3b7660072b6c324d800b6631bb3035e1c7043580d430944946f8465da7e401d45ba0640ce0e79d593dd696904e, x-ror-kibana-request-method=get, x-ror-kibana-request-path=/s/default/api/spaces/space, x-ror-current-group=admins_group, x-elastic-product-origin=kibana, content-type=application/vnd.elasticsearch+json; compatible-with=9, Content-Length=312, x-opaque-id=unknownId, keep-alive=timeout=10, max=1000, connection=keep-alive, Accept-Charset=utf-8, x-ror-kibana-index=.kibana_admins_group, x-forwarded-for=192.168.65.1, accept=application/vnd.elasticsearch+json; compatible-with=9, tracestate=es=s:0, Host=localhost:9200, x-ror-correlation-id=7f709e55-0eb5-44da-9f80-664393409e1c, Authorization=<OMITTED>, HIS:[KIBANA_SERVER-> RULES:[auth_key->false] RESOLVED:[group=admins_group;indices=.kibana_admins_group]], [USER_DEFAULT-> RULES:[auth_key->false] RESOLVED:[group=admins_group;indices=.kibana_admins_group]], [PERSONAL_GRP-> RULES:[groups_any_of->false] RESOLVED:[group=admins_group;indices=.kibana_admins_group]], [ADMIN_GRP-> RULES:[groups_any_of->true, kibana->true] RESOLVED:[user=admin;group=admins_group;av_groups=admins_group;indices=.kibana_admins_group;kibana_idx=.kibana_admins_group]], }                                                   

Hi @Dzuming I checked ES Logs and I do not see any errors related to the event when I click ‘Download‘

*maybe I should have mentioned that I use multiple kibana instances with specific “kibana.index“ in kibana.yml and the report was ‘Processed by’ different Kibana instance.

It won’t be an error, but an allowed log. The case is that maybe it is a problem with determining the correct Kibana index for this specific ES call

the report was ‘Processed by’ different Kibana instance.

Could you elaborate on? How do you know it? Does it mean that you create a report in the Kibana instance, kibana.index: x and you are able to see this report and click download in the Kibana instance with kibana.index: y?

“Does it mean that you create a report in the Kibana instance, kibana.index: x and you are able to see this report and click download in the Kibana instance with kibana.index: y

Yes and No :wink: I see that report only in “Reporting app” in that kibana instance(where I’ve generated it) + index “.ds-.kibana-reporting-.kibana-X-2026.02.24-000001“ and the only difference is “Processed by”(another kibana_instance).

and the only difference is “Processed by”(another kibana_instance).

Since the task manager in Kibana is shared between all Kibana instances, it’s possible that instance X initialized report generation, but it will be processed by instance Y

Could you check if the Kibana index in the PTH:/<KIBANA_INDEX>/_search is different from what is declared in the kibana.index settings from kibana.yml? It will tell us whether the problem is with the index replacement.

How can I see this log? In debug mode via ES and/or ror user config with verbosity: info?

You should see it by default in the Elasticsearch logs, if you don’t set verbosity: error in the user ACL block.

I’ve checked ES logs with “verbosity:info“ only for one ‘user ACL block’. And after log in as that user in kibana, searching some data and then generated report I see these PTH in logs:

“PTH:/.kibana-X/_doc/space:default”

“PTH:/KBN_INDEX_PATTERN-*/_field_caps“

“PTH:/KBN_INDEX_PATTERN-*/_async_search“

“PTH:/.kibana-X_analytics_8.19.7/_search“

“PTH:/.kibana-X/_pit“

“PTH:/.kibana-X/_doc/config:8.19.7“

“PTH:/_search“

“PTH:/_data_stream/logs“, “PTH:/_pit“

“PTH:/_readonlyrest/metadata/current_user“

I tried to investigate and would like to addtionaly ask about that “kibana_address/s/default/api/reporting/jobs/download/XXXX“. Is it used by kibana ‘by default’ or added/used via Readonlyrest? It doesn’t seem to be official URL like in previous 7.X versions Automatically generate reports | Kibana Guide [8.19] | Elastic

I’ve checked ES logs with “verbosity:info“ only for one ‘user ACL block’. And after log in as that user in kibana, searching some data and then generated report I see these PTH in logs:

Thanks for checking, Kibana indices look correct

It’s a Kibana endpoint to generate reports

Ohh, I’m sorry, not that one endpoint. I thought about that one “kibana_address/s/default/internal/reporting/jobs/download/XXXX-XXX-XXX-XXX-XXX?elasticInternalOrigin=true“(where I get redirected when I click download for the report) with additional ‘/internal/‘(in place of ‘api‘) :wink: Maybe in 8.19 the user needs permissions.

This one is also a Kibana internal endpoint

Maybe in 8.19 the user needs permissions

On the plugin side, there is no special permission in this case

I suspect there’s a problem with “[plugins.security.config] Generating a random key for xpack.security.encryptionKey“.

I had custom one in kibana.yml in 8.19.7 for all instances but when I removed it and rely on “Generating a random key for xpack.security.encryptionKey.“ sometimes I can download the report and then I cannot.

If I understand correctly, the problem occurs after removing the custom, xpack.security.encryptionKey Which was the same for all Kibana instances, right?

If yes, I think it’s required to share this value between all instances, because of the Kibana task manager, which can delegate report generating to the different Kibana instance, with different encryption key.

Yes, at first I had the same “xpack.security.encryptionKey“ for all kibana instances. Now I don’t use it at all and the problem is the same as before.

I think there’s some restriction on the plugin side for KBN 8.19.X.

“xpack.security.encryptionKey“ is not necessary if xpack.security.enabled is false. For 7.17.X it also worked well without it.

(*from Reporting settings in Kibana | Kibana Guide [8.19] | Elastic )

I checked the “download” for reports generated earlier but in Kibana without plugin installed, connected to node(within the same ES cluster) also without plugin + without “kibana.index“ in kibana.yml, so probably using the default index “.kibana_8.19.7_001” and everytime it worked without any errors.

But when I try to generate new report I see that is ‘Processed by‘ another kibana instance(with Readonlyrest plugin) and it Fails with “Message” Cannot create CSV report for ‘Untitled Discover session’.
ReportingError(code: unknown_error) “My_ROR_custom_message: forbidden_response Root causes: forbidden_response: My_ROR_custom_message.”

*”My_ROR_custom_message” is from readonlyrest config for “readonlyrest.response_if_req_forbidden“

In my kibana.yml for all instances I use “xpack.reporting.encryptionKey“ and “xpack.encryptedSavedObjects.encryptionKey“.

@mikeIT please reproduce your use case in ROR Sandbox. We will run it and check what is wrong.

At the moment we don’t have your env setup so it’s difficult for us to say what’s the problem is.

Hi @coutoPL I understand, but could I know what basic configuration do I need for 8.19.7 in kibana.yml and readonlyrest.yml for Kibana Reporting(report generation and downloading) to work properly with ROR License Free, ES xpack.security.enabled:false and using different kibana.index in kibana.yml for multiple kibana instances?

Take a look at our docker-based environment in our E2E tests: readonlyrest-e2e-tests/environments/elk-ror at master · beshu-tech/readonlyrest-e2e-tests · GitHub

We have there 2 KBN instances and we run our reporting tests against this env.

Thank you. I don’t see something similar to “my case“ :wink: when I want to use parameter kibana.index (.kibana_A + .kibana_B) for two different kibana instances, but I willl try to test it.

Just to clarify, I understand this is not your production case.

What you’re seeing comes from an internal test scenario on our side: we use it to validate that Kibana Reporting works correctly on environments where we officially support multitenancy.

Multitenancy is available with the ReadonlyREST Enterprise license.

Regarding kibana.index: Kibana itself stopped supporting this setting starting from 8.0.0. We only ported an equivalent setting for a specific PRO customer who needed to change the Kibana index name (for legacy reasons). It was never intended to provide an alternative “free multitenancy” mechanism or to emulate Kibana multitenancy.

Because of that, the issues you’re observing can absolutely happen: this “multi-instance + different kibana index” approach has never been a supported multitenancy solution in ROR, and we don’t plan to support it going forward - we already provide a dedicated multitenancy implementation that is heavily tested and proven across many customer deployments.

If your goal is multitenancy + stable Reporting, the supported path is to use the Enterprise multitenancy features. If you only need a custom Kibana index name (single-tenant), then kibana.index is fine - but mixing it as a multitenancy mechanism is out of scope and may lead to exactly these edge cases.