Hello,
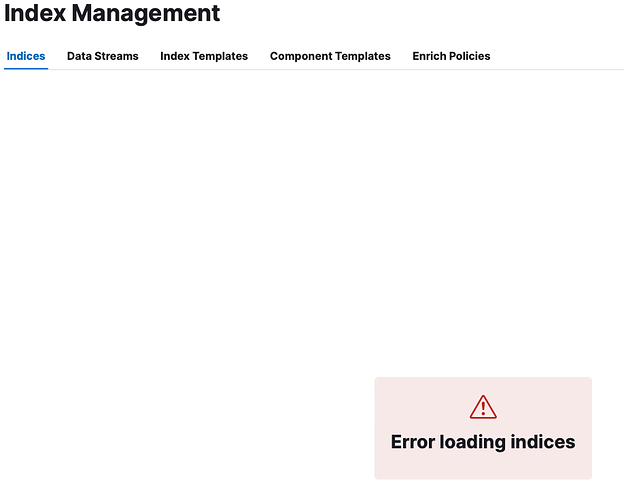
When I try to list indices using kibana with RoR I’m getting error:
Jul 30 13:07:59 logs kibana[8538]: Error: socket hang up
Jul 30 13:07:59 logs kibana[8538]:     at Socket.socketCloseListener (node:_http_client:473:25)
Jul 30 13:07:59 logs kibana[8538]:     at Socket.emit (node:events:531:35)
Jul 30 13:07:59 logs kibana[8538]:     at TCP.<anonymous> (node:net:338:12)
Jul 30 13:07:59 logs kibana[8538]:     at TCP.callbackTrampoline (node:internal/async_hooks:130:17)
Jul 30 13:08:04 logs kibana[8538]: [13:08:04:072] [info][plugins][ReadonlyREST][authController][x-ror-correlation-id=5d3bf4cd-8221-40ef-8a88-1d98c92c04f4] Refreshing session against ES
Jul 30 13:08:29 logs kibana[8538]: Error: socket hang up
Jul 30 13:08:29 logs kibana[8538]:     at Socket.socketCloseListener (node:_http_client:473:25)
Jul 30 13:08:29 logs kibana[8538]:     at Socket.emit (node:events:531:35)
Jul 30 13:08:29 logs kibana[8538]:     at TCP.<anonymous> (node:net:338:12)
Jul 30 13:08:29 logs kibana[8538]:     at TCP.callbackTrampoline (node:internal/async_hooks:130:17)
Jul 30 13:08:52 logs kibana[8538]: [13:08:52:766] [info][plugins][ReadonlyREST][authController][x-ror-correlation-id=5d3bf4cd-8221-40ef-8a88-1d98c92c04f4] Refreshing session against ES
Jul 30 13:08:59 logs kibana[8538]: Error: socket hang up
Jul 30 13:08:59 logs kibana[8538]:     at Socket.socketCloseListener (node:_http_client:473:25)
Jul 30 13:08:59 logs kibana[8538]:     at Socket.emit (node:events:531:35)
Jul 30 13:08:59 logs kibana[8538]:     at TCP.<anonymous> (node:net:338:12)
Jul 30 13:08:59 logs kibana[8538]:     at TCP.callbackTrampoline (node:internal/async_hooks:130:17)
Jul 30 13:09:27 logs kibana[8538]: [13:09:27:507] [info][plugins][ReadonlyREST][authController][x-ror-correlation-id=5d3bf4cd-8221-40ef-8a88-1d98c92c04f4] Refreshing session against ES
Jul 30 13:09:28 logs kibana[8538]: Error: socket hang up
Jul 30 13:09:28 logs kibana[8538]:     at Socket.socketOnEnd (node:_http_client:524:23)
Jul 30 13:09:28 logs kibana[8538]:     at Socket.emit (node:events:531:35)
Jul 30 13:09:28 logs kibana[8538]:     at endReadableNT (node:internal/streams/readable:1696:12)
Jul 30 13:09:28 logs kibana[8538]:     at processTicksAndRejections (node:internal/process/task_queues:82:21)
Jul 30 13:09:29 logs kibana[8538]: Error: socket hang up
Jul 30 13:09:29 logs kibana[8538]:     at Socket.socketCloseListener (node:_http_client:473:25)
Jul 30 13:09:29 logs kibana[8538]:     at Socket.emit (node:events:531:35)
Jul 30 13:09:29 logs kibana[8538]:     at TCP.<anonymous> (node:net:338:12)
Jul 30 13:09:29 logs kibana[8538]:     at TCP.callbackTrampoline (node:internal/async_hooks:130:17)
On web ui errors is:
Right now I have 4058 indices on one VM. Data is sent using filbeat agent installed on multiple clients.
Elasticsearch version: 8.14.1
Elasticsearch plugin version: readonlyrest-1.59.0-pre1_es8.14.1.zip
Kubana plugin version: readonlyrest_kbn_universal-1.57.3_es8.14.1.zip
VM Resources are:
CPU: 16core
RAM: 32G
Can I find a way to list indices without error? Even using API I am not able to modify data views.
Thanks
