Hi Gents!
I just started using Pro version today (it is awesome  but/and also faced with monitoring problems.
I used snippet from docs and log in as kibana server user with full access (as I correctly understand)
- name: "::KIBANA-SRV::"
  auth_key: kibana:kibana
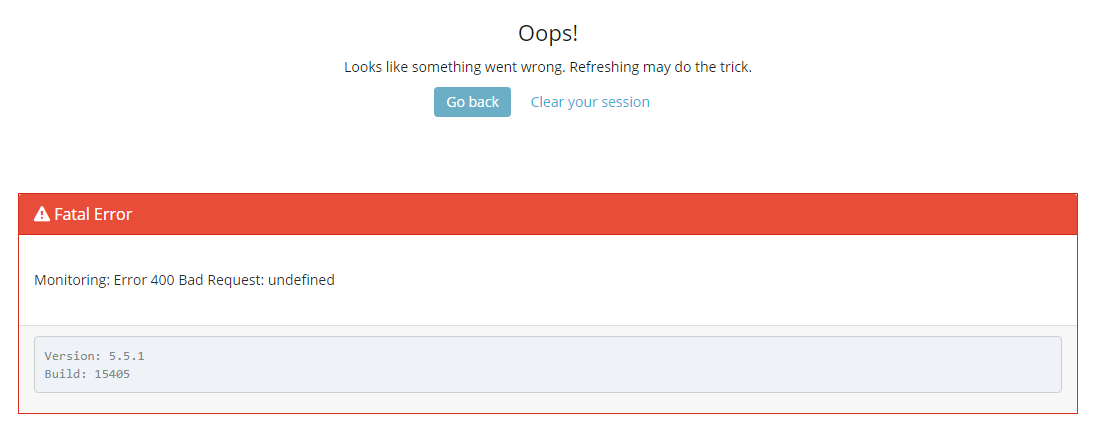
then proceed to monitoring tab and got an error:
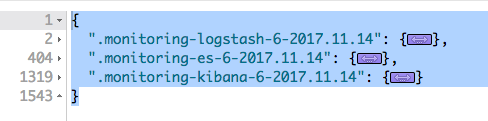
Monitoring indices exists:
Nothing interesting in ES logs, but in Kibana have an:
{“type”:“request”,“@timestamp”:“2017-11-14T20:17:20Z”,“tags”:[“monitoring-ui”,“error”],“pid”:1,“level”:“error”,“message”:“Authorization Exception”,“error”:{“message”:“Authorization Exception”,“name”:“Error”,“stack”:“Authorization Exception :: {"path":"/.monitoring-es-2-%2C.monitoring-es-6-/_search","query":{"filter_path":"hits.hits._source.cluster_uuid,hits.hits._source.cluster_name,hits.hits._source.version,hits.hits._source.license,hits.hits._source.cluster_stats,hits.hits._source.cluster_state"},"body":"{\"size\":10000,\"query\":{\"bool\":{\"filter\":[{\"bool\":{\"should\":[{\"term\":{\"_type\":\"cluster_stats\"}},{\"term\":{\"type\":\"cluster_stats\"}}]}},{\"range\":{\"timestamp\":{\"format\":\"epoch_millis\",\"gte\":1510687040611,\"lte\":1510690640612}}}]}},\"collapse\":{\"field\":\"cluster_uuid\"},\"sort\":{\"timestamp\":{\"order\":\"desc\"}}}","statusCode":403,"response":""}\n at respond (/usr/share/kibana/node_modules/elasticsearch/src/lib/transport.js:295:15)\n at checkRespForFailure (/usr/share/kibana/node_modules/elasticsearch/src/lib/transport.js:254:7)\n at HttpConnector. (/usr/share/kibana/node_modules/elasticsearch/src/lib/connectors/http.js:159:7)\n at IncomingMessage.bound (/usr/share/kibana/node_modules/elasticsearch/node_modules/lodash/dist/lodash.js:729:21)\n at emitNone (events.js:91:20)\n at IncomingMessage.emit (events.js:185:7)\n at endReadableNT (_stream_readable.js:974:12)\n at _combinedTickCallback (internal/process/next_tick.js:80:11)\n at process._tickDomainCallback (internal/process/next_tick.js:128:9)”}}
got an error [403] Forbidden { Error: Insufficient user permissions for monitoring data
at handleError (/usr/share/kibana/plugins/x-pack/plugins/monitoring/server/lib/handle_error.js:25:17)
at /usr/share/kibana/plugins/x-pack/plugins/monitoring/server/routes/api/v1/cluster/clusters.js:34:22
at throw (native)
at step (/usr/share/kibana/plugins/x-pack/plugins/monitoring/server/routes/api/v1/cluster/clusters.js:20:191)
at /usr/share/kibana/plugins/x-pack/plugins/monitoring/server/routes/api/v1/cluster/clusters.js:20:402
data: null,
isBoom: true,
isServer: false,
output:
{ statusCode: 403,
payload:
{ statusCode: 403,
error: ‘Forbidden’,
message: ‘Insufficient user permissions for monitoring data’ },
headers: { ‘kbn-name’: ‘kibana’, ‘kbn-version’: ‘5.6.3’ } },
reformat: [Function] }
{“type”:“response”,“@timestamp”:“2017-11-14T20:17:20Z”,“tags”:,“pid”:1,“method”:“post”,“statusCode”:400,“req”:{“url”:“/api/monitoring/v1/clusters”,“method”:“post”,“headers”:{“host”:“kibana.k8s.com”,“connection”:“close”,“x-real-ip”:“172.27.0.2”,“x-forwarded-for”:“172.27.0.2”,“x-forwarded-host”:“kibana.k8s.com”,“x-forwarded-port”:“80”,“x-forwarded-proto”:“http”,“x-original-uri”:“/api/monitoring/v1/clusters”,“x-scheme”:“http”,“content-length”:“81”,“user-agent”:“Mozilla/5.0 (Macintosh; Intel Mac OS X 10.11; rv:56.0) Gecko/20100101 Firefox/56.0”,“accept”:“application/json, text/plain, /”,“accept-language”:“en-US,en;q=0.5”,“accept-encoding”:“gzip, deflate”,“referer”:“http://kibana.k8s.com/app/monitoring",“content-type”:“application/json;charset=utf-8”,“kbn-version”:“5.6.3”},“remoteAddress”:“100.96.11.9”,“userAgent”:“100.96.11.9”,“referer”:“http://kibana.k8s.com/app/monitoring”},“res”:{“statusCode”:400,“responseTime”:15,“contentLength”:9},“message”:"POST /api/monitoring/v1/clusters 400 15ms - 9.0B”}
Why security goes via x-pack if its have already disabled or what does it mean at all?
ROR version - 1.16.12_es5.6.3
ROR Kibana PRO - 1.16.13-20171113_es5.6.3
ES/Kibana - 5.6.3
Thanks in advance!
 , but having it as a user controlled setting could be a good feature to have.
