Kibana: 7.14.1
readonlyrestkbn free:1.34.0
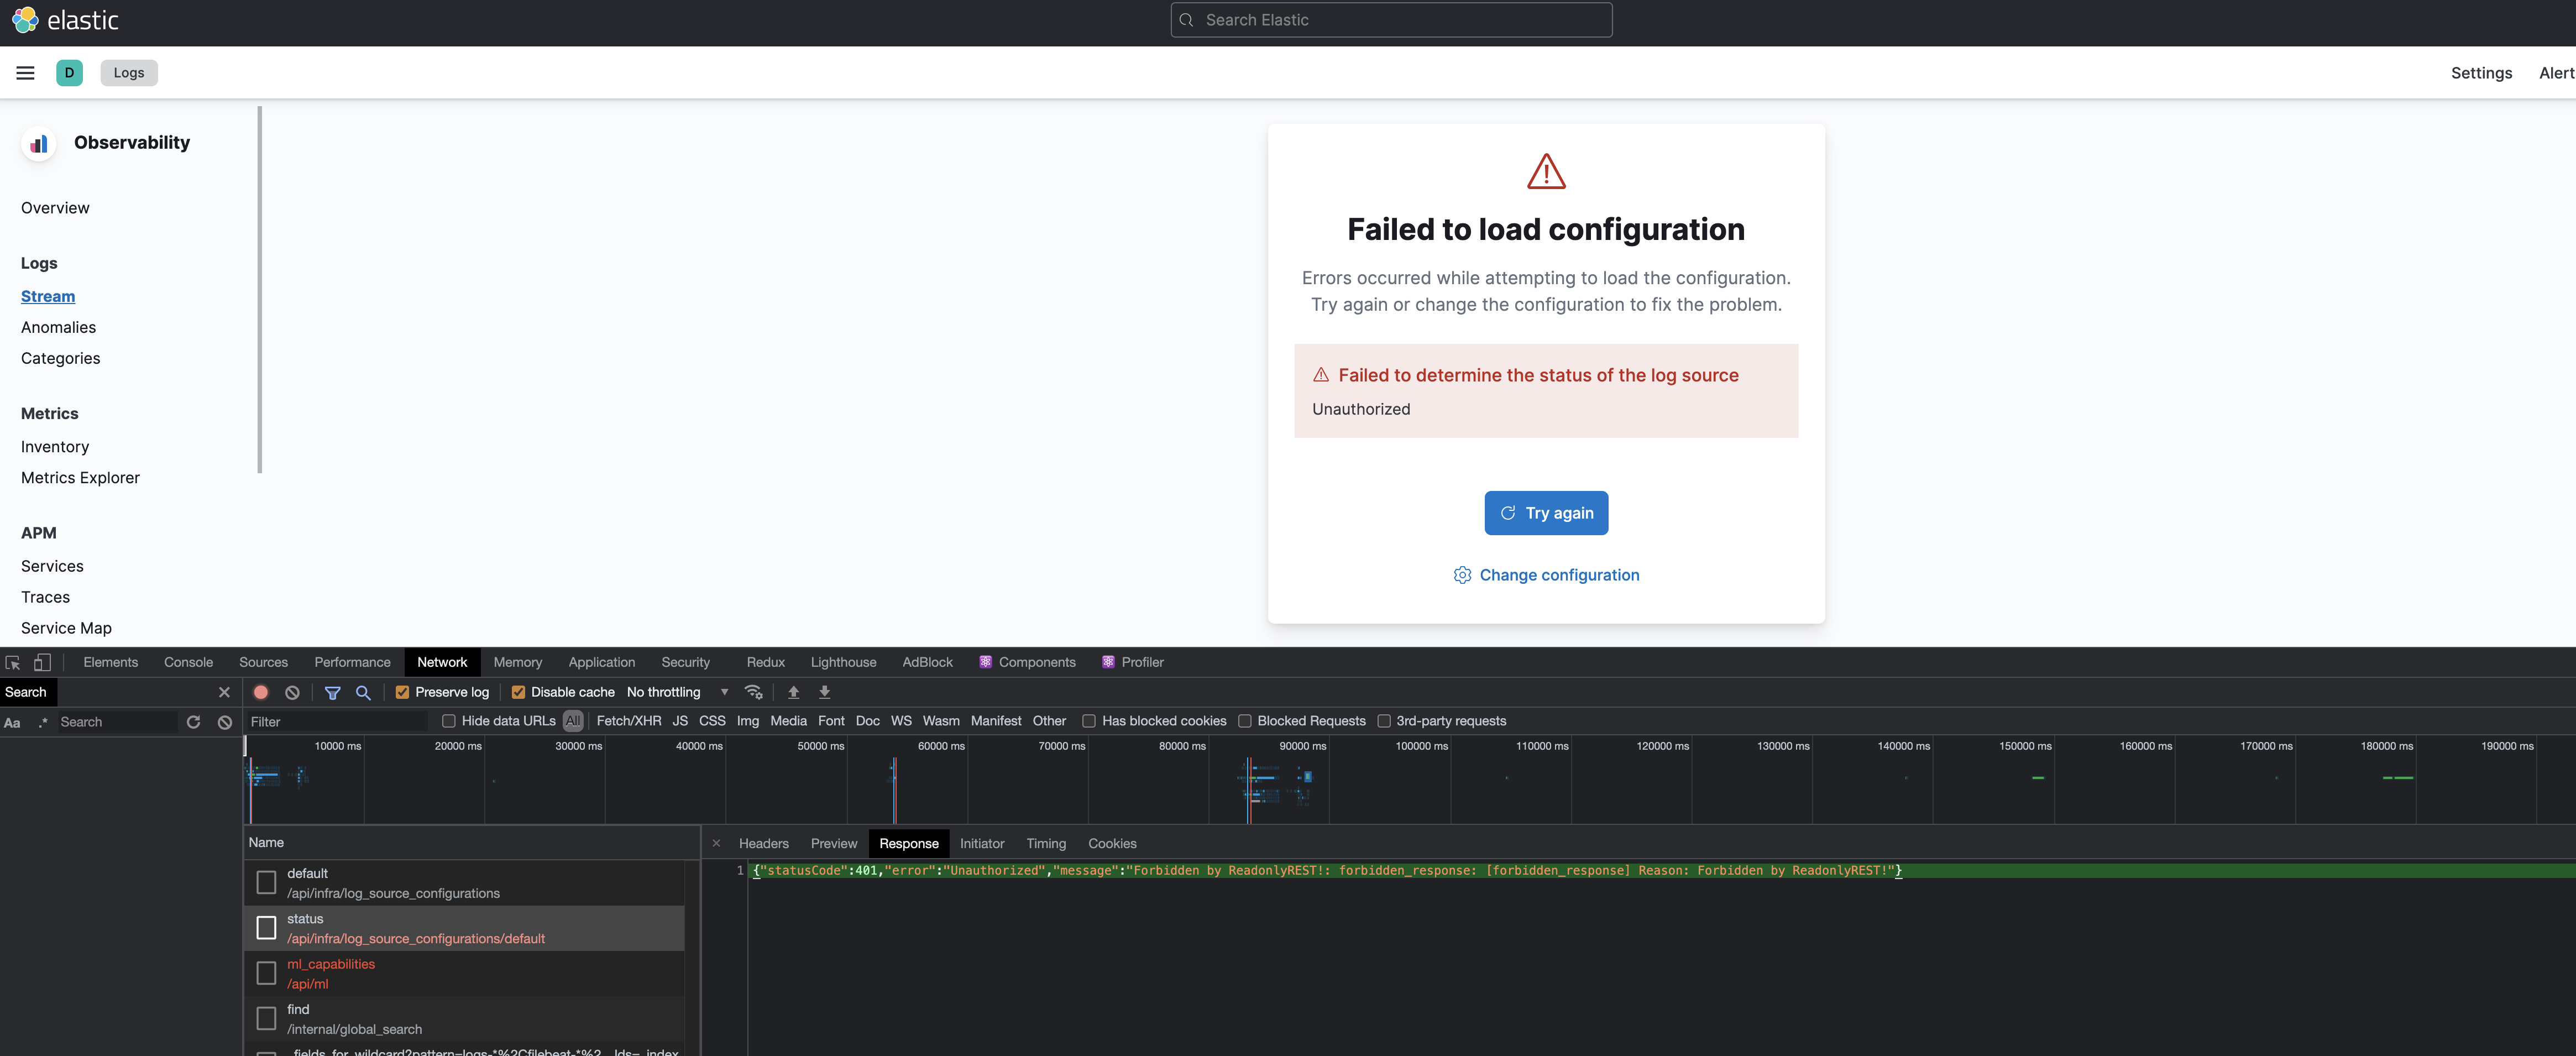
When I try to enter Observability>Logs I will get unauthorized for API call api/infra/log_source_configurations/default/status
I’m using user who has kibana_access: unrestricted
Kibana: 7.14.1
readonlyrestkbn free:1.34.0
When I try to enter Observability>Logs I will get unauthorized for API call api/infra/log_source_configurations/default/status
I’m using user who has kibana_access: unrestricted
Could you please retrieve the corresponding forbidden log line in elasticsearch logs?
It should be this one
{"type": "server", "timestamp": "2021-09-14T21:53:35,616Z", "level": "INFO", "component": "t.b.r.a.l.AccessControlLoggingDecorator", "cluster.name": "es-cluster", "node.name": "es", "message": "\u001B[35mFORBIDDEN by default req={ ID:1562338982-1116778321#21562, TYP:GetRequest, CGR:N/A, USR:[no info about user], BRS:true, KDX:null, ACT:indices:data/read/get, OA:172.18.0.3/32, XFF:null, DA:172.18.0.2/32, IDX:.kibana, MET:GET, PTH:/.kibana/_doc/infrastructure-ui-source:default, CNT:<N/A>, HDR:Accept-Charset=utf-8, Host=es:9200, connection=close, content-length=0, user-agent=elasticsearch-js/7.14.0-canary.7 (linux 5.10.47-linuxkit-x64; Node.js v14.17.5), x-elastic-client-meta=es=7.14.0p,js=14.17.5,t=7.14.0p,hc=14.17.5, x-elastic-product-origin=kibana, x-opaque-id=9bf206a3-85da-4231-a128-083011bbe373, HIS:[Require HTTP Basic Auth-> RULES:[auth_key->false] RESOLVED:[indices=.kibana]], }\u001B[0m", "cluster.uuid": "T1sXKjPcRkaXUtFcWMgxHA", "node.id": "dHnjAVzoTYObLQhr-7c3xQ" }
my ror config
readonlyrest:
  access_control_rules:
    - name: "Require HTTP Basic Auth"
      type: allow
      auth_key: elastic:elastic
      kibana_access: unrestricted
OK just tested this in 7.14.1 with latest ror and my test ACL. Cannot reproduce this. In fact, here is my log line, correctly showing with Authorization header in place, and being ALLOWED.
[n1_it] ALLOWED by { name: ‘ADMIN_GRP’, policy: ALLOW, rules: [groups,kibana_hide_apps,kibana_index,kibana_access] req={ ID:1393389206-789633792#8114, TYP:GetRequest, CGR:Administrators, USR:admin, BRS:true, KDX:.kibana_admins, ACT:indices:data/read/get, OA:127.0.0.1/32, XFF:localhost:5601, DA:127.0.0.1/32, IDX:.kibana_admins, MET:GET, PTH:/.kibana_admins/_doc/infrastructure-ui-source:default, CNT:<N/A>, HDR:Accept-Charset=utf-8, Authorization=, Host=localhost:9200, connection=close, content-length=0, cookie=rorCookie-SP={%22createdAtMillis%22:1631697565423%2C%22intervalMillis%22:60000}, user-agent=elasticsearch-js/7.14.0-canary.7 (linux 5.11.0-34-generic-x64; Node.js v14.17.5), x-elastic-client-meta=es=7.14.0p,js=14.17.5,t=7.14.0p,hc=14.17.5, x-elastic-product-origin=kibana, x-forwarded-for=localhost:5601, x-opaque-id=a341b774-5545-408f-84bb-d182e3dc4e98, x-ror-current-group=Administrators, x-ror-kibana-request-method=post, x-ror-kibana-request-path=/api/log_entries/summary, HIS:[KIBANA_SERVER-> RULES:[auth_key->false] RESOLVED:[group=Administrators;indices=.kibana_admins]], [PERSONAL_GRP-> RULES:[groups->false] RESOLVED:[group=Administrators;indices=.kibana_admins]], [ADMIN_GRP-> RULES:[groups->true, kibana_hide_apps->true, kibana_index->true, kibana_access->true] RESOLVED:[user=admin;group=Administrators;av_groups=Administrators;indices=.kibana_admins;kibana_idx=.kibana_admins]], }
At this stage, I suspect there’s something fishy with the ACL configuration. Can you share the YAML?
I can reproduce it in a minimal docker enviroment. Here is the config which I’m using.
kibana.yml
server.port: 5601
server.host: "0.0.0.0"
elasticsearch.hosts: ["http://es:9200"]
elasticsearch.ssl.verificationMode: none
elasticsearch.username: "elk"
elasticsearch.password: "elk"

telemetry.enabled: false

# -----------------------------------Xpack-----------------------------------------------
xpack.security.enabled: false
xpack.encryptedSavedObjects.encryptionKey: "McQfTjWnZr4u7x!A%D*F-JaNdRgUkXp2s5v8y/B?E(H+KbPeShVmYq3t6w9z$C&F"
readonlyrest.yml
readonlyrest:
  access_control_rules:
    - name: "Require HTTP Basic Auth"
      type: allow
      auth_key: elk:elk
      kibana_access: unrestricted
elasticsearch.yml
node.name=es
cluster.name=es-cluster
cluster.initial_master_nodes=es
xpack.security.enabled=false
If you want to run it, here’s my docker compose
version: "3.8"
services:
  es:
    build:
      dockerfile: ./Dockerfile_es
    container_name: es
    environment:
      - node.name=es
      - cluster.name=es-cluster
      - cluster.initial_master_nodes=es
      - xpack.security.enabled=false
      - bootstrap.memory_lock=true
      - "ES_JAVA_OPTS=-Xms512m -Xmx512m"
    ulimits:
      memlock:
        soft: -1
        hard: -1
    ports:
      - 9200:9200
    volumes:
      - ./ror/readonlyrest.yml:/usr/share/elasticsearch/config/readonlyrest.yml
  kibana:
    build:
      dockerfile: ./Dockerfile_kibana
    container_name: kibana
    ports:
      - 5601:5601
    volumes:
      - ./ror/kibana.yml:/usr/share/kibana/config/kibana.yml
    depends_on:
      - es
And docker files
Dockerfile_es
FROM docker.elastic.co/elasticsearch/elasticsearch:7.14.1

COPY ./ror /ror

RUN bin/elasticsearch-plugin install --batch file:///ror/readonlyrest-1.34.0_es7.14.1.zip
Dockerfile_kibana
FROM docker.elastic.co/kibana/kibana:7.14.1

COPY ./ror /ror

RUN bin/kibana-plugin install file:///ror/readonlyrest_kbn_free-1.34.0_es7.14.1.zip

RUN node/bin/node plugins/readonlyrestkbn/ror-tools.js patch
Thanks to your docker compose, I could reproduce it. And I spent 2 hours bisecting the issue between my version and your version.
Turns out, I had this setting in place in my kibana.yml that makes it work. But I’m not sure yet why.
readonlyrest_kbn.whitelistedPaths: [ .*/api/status$ ]
Will open a task for further investigating this issue.
Hi, @aizerin I confirm that thanks to your config we were able to reproduce and fix this issue. We will add a fix in the next release of readonlyrestkbn plugin