StefanD
September 8, 2025, 2:41pm
1
Hello!
I am experiencing an issue with filters in the Kibana Discover / Data View section.
Previously, I was using Kibana v8.6.2 together with the ReadonlyRest plugin v1.51 . For testing purposes, I created a small index with the following mapping:{ “test-keyword”: { “mappings”: { “properties”: { “testing”: { “type”: “text”, “fields”: { “keyword”: { “type”: “keyword”, “ignore_above”: 256 } } } } } } }}
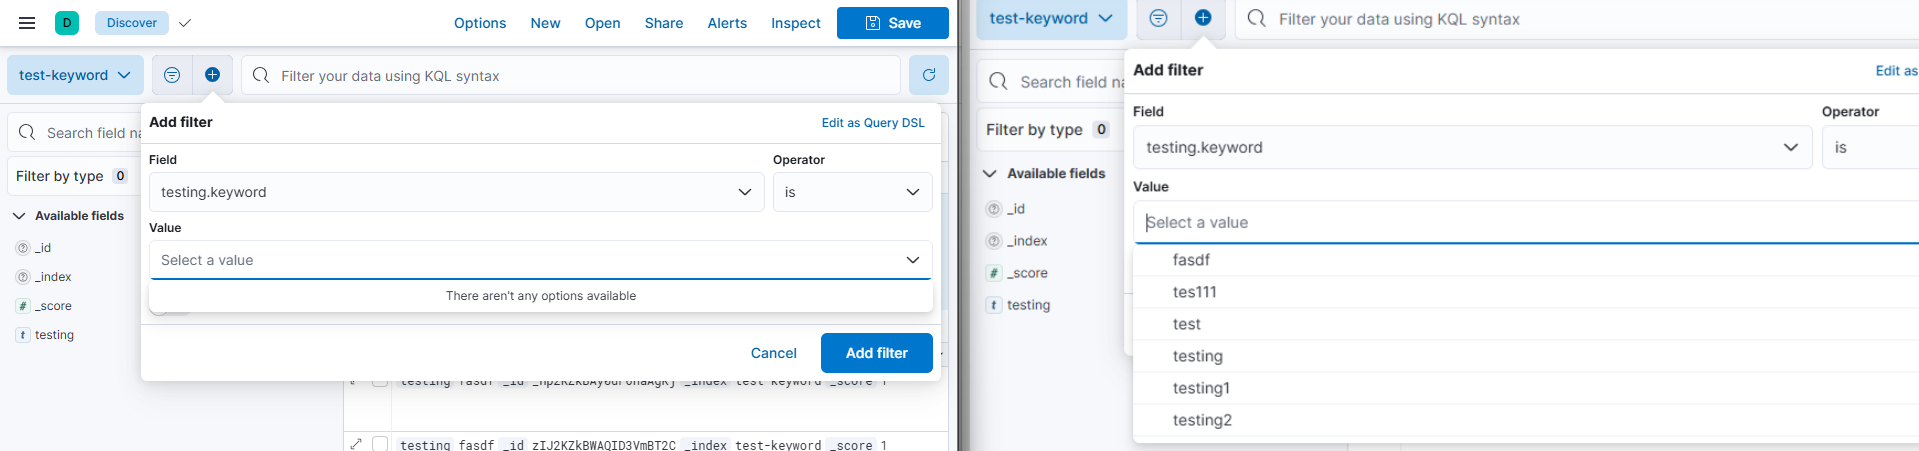
Doing the same thing with kibana version 8.6.2 and ReadonlyRest version 1.60 and 1.66.1 It was not working as expected
Left image: Kibana 8.6.2, RoR 1.60 & 1.66.1
I used the exact same index, with the exact same mapping.
Do you have some ideas of why this could not work?
Dzuming
September 9, 2025, 4:36am
2
Hello @StefanD
It looks like a similar topic to the Trying to create a filter in Kibana, there is no proposal .
Could you share your kibana.yml and readonlyrest.yml settings?
Could you show es logs? Are there any forbidden responses with x-ror-kibana-request-path=/s/default/api/kibana/suggestions/valuesphrase?
StefanD
September 9, 2025, 7:21am
3
here is the readonlyrest.yaml and kibana.yaml. I was connected as fulladmin user when performed the test.


readonlyrest:
  prompt_for_basic_auth: false
  access_control_rules:

    - name: "Kibana service account"
      # verbosity: error
      token_authentication:
        token: "Bearer ${KIBANA_SERVICE_ACCOUNT_TOKEN}"
        username: service_account

    - name: "ELASTIC-INTERNAL"
      # verbosity: debug
      auth_key: "elastic-internal:${INTERNAL_USR_PASS}"

    - name: "ELASTIC INTERNAL PROBE"
      type: allow
      # verbosity: debug
      auth_key: "elastic-internal-probe:${INTERNAL_PROBE_PASS}"

    - name: "Full Admin Kibana"
      groups: ["full-admin"]
      indices: ["*"]
      kibana_access: "admin"

    - name: "Full Admin Users"
      groups: ["full-admin"]
      indices: ["*"]
      actions: ["*"]

    - name: "Client Admin Group Kibana"
      groups: ["client_admin"]
      indices: ["kibana_client_admin", "*"]
      kibana_access: "rw"
      kibana_index: "kibana_client_admin"

    - name: "Client Admin Group 0"
      groups: ["client_admin"]
      indices: ["*"]
      actions: ["*"]
  users:
    - username: "fulladmin"
      groups: ["full-admin"]
      auth_key_sha256: "dfdfasdfasdfadfasfadfa"
    - username: "xxxx1234"
      groups: ["client_admin"]
      ror_kbn_auth:
        name: "kbn1"
  ror_kbn:
  - name: kbn1
    signature_key: "xxxxxxx"
  jwt:
  - name: "jwt_provider"
    signature_algo: "RSA"
    signature_key: "xxxxxxx"
    user_claim: "sub"
    header_name: "Authorization"


csp:
    script_src:
        - '''unsafe-eval'' ''unsafe-inline'' https://www.gstatic.com/ https://d3js.org/ https://cdn.jsdelivr.net/ https://cdnjs.cloudflare.com/ https://cdn.datatables.net/ ''self'' ''blob:'''
    strict: false
    style_src:
        - https://use.fontawesome.com/ https://stackpath.bootstrapcdn.com/ https://unpkg.com/ https://www.gstatic.com/ https://d3js.org/ https://cdn.jsdelivr.net/ https://cdnjs.cloudflare.com/ https://cdn.datatables.net/ 'self' 'blob:'
    warnLegacyBrowsers: false
elastalertKibanaPlugin:
    serverHost: elastalert2-server.test.svc.cluster.local
    serverPath: ""
    serverPort: 80
    serverSsl: false
elasticsearch:
    hosts:
        - https://test.test.svc:9200
    serviceAccountToken: xxxxxxx
    ssl:
        certificateAuthorities: /usr/share/kibana/config/elasticsearch-certs/ca.crt
        verificationMode: certificate
kibana:
    autocompleteTerminateAfter: 3e+06
    autocompleteTimeout: 300000
monitoring:
    ui:
        container:
            elasticsearch:
                enabled: true
readonlyrest_kbn:
    auth:
        oidc_kc:
            authorizationURL: https://test.com/oauth2/authorize
            buttonName: Connect
            clientID: xxxxx
            clientSecret: xxxxxx
            groupsParameter: groups
            issuer: https://test.com
            jwksURL: https://test.com/oauth2/jwks
            kibanaExternalHost: test.cluster
            logoutUrl: https://test.cluster/logout
            protocol: https
            scope: openid email
            tokenEndpointAuthMethod: client_secret_post
            tokenURL: https://test.com/oauth2/token
            type: oidc
            userInfoURL: https://test.com/oauth2/userinfo
            usernameParameter: sub
        signature_key: xxxxxx
    clearSessionOnEvents:
        - never
    cookiePass: xxxxx
    license:
        activationKeyFilePath: /usr/share/kibana/plugins/readonlyrestkbn/ROR_ACTIVATION_KEY.txt
        activationKeyRetrievalMode: file
    logLevel: info
    logPrettyPrintEnabled: true
server:
    cors: true
    host: 0.0.0.0
    name: test
    publicBaseUrl: https://test.cluster/
    ssl:
        certificate: /mnt/elastic-internal/http-certs/tls.crt
        enabled: true
        key: /mnt/elastic-internal/http-certs/tls.key
telemetry:
    optIn: false
xpack:
    encryptedSavedObjects:
        encryptionKey: xxxxx
    fleet:
        agents:
            enabled: false
    license_management:
        ui:
            enabled: false
    reporting:
        encryptionKey: xxxxx
    security:
        encryptionKey: xxxxxx
There is no forbidden response on x-ror-kibana-request path=/s/default/api/kibana/suggestions/valuein es logs
coutoPL
September 10, 2025, 9:02am
4
@StefanD FYI: We reproduced the issue. Currently, we are working on the fix. We will send you a pre-build when the fix is done.
coutoPL
October 5, 2025, 10:07am
5
@StefanD This is fixed. Here is a pre-build to test:ROR 1.67.0-pre6 for 8.6.2
coutoPL
October 14, 2025, 7:01am
6
This is fixed in just-released ROR 1.67.0