Hi, All.
Please help.
ROR Version: Enterprise 1.64.2_es7.17.25 ![]()
Kibana Version: 7.17.25
Elasticsearch Version: 7.17.25
Steps to reproduce the issue
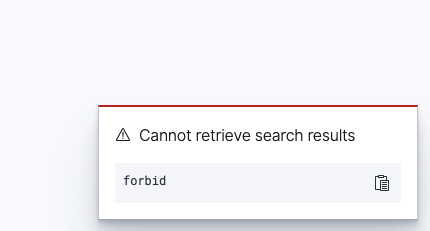
Try to find the log in “discover”
access log elasticsearch
ALLOWED by { name: 'Allow unrestricted access to team', policy: ALLOW, rules: [NonEmptyList(ldap_authentication, ldap_authorization, kibana_access)] req={ ID:7779bbd2-866f-4285-b050-66d1629a0605-1420571681#157733, TYP:RRUserMetadataRequest, CGR:team, USR:user, BRS:true, KDX:.kibana, ACT:cluster:internal_ror/user_metadata/get, OA:127.0.0.1/32, XFF:1.1.1.1, 2.2.2.2, DA:127.0.0.1/32, IDX:<N/A>, MET:GET, PTH:/_readonlyrest/metadata/current_user, CNT:<N/A>, HDR:X-Forwarded-For=1.1.1.1, 2.2.2.2, Accept-Encoding=gzip,deflate, Host=elasticsearch, X-Passed-Nginx=true, Accept=*/*, User-Agent=node-fetch/1.0 (+https://github.com/bitinn/node-fetch), content-length=0, cookie=x-csrf-token-MTI3LjAuMC4xOjU2MDE=c68819d05d976528db35e94f51e2765eb3b28e150b16caf43af76fe99040eda3300ec51b9061c0f55e34927e9cf125c6ee065bcb42937c9be8b8645eb565c90a%7C7f08b0c2d39b1478205e7669e267308563a02ffc0cc2a3190ce7594988ebe47f, Connection=close, x-ror-current-group=team, Authorization=<OMITTED>, x-ror-correlation-id=7779bbd2-866f-4285-b050-66d1629a0605, x-forwarded-for=10.13.15.159, x-passed-nginx=true, X-Forwarded-Proto=https, HIS:[Allow unrestricted access to team users-> RULES:[ldap_authentication->true, ldap_authorization->true, kibana_access->true] RESOLVED:[user=user;group=team;av_groups=team;kibana_idx=.kibana]], [.readonlyrest forbid-> RULES:[actions->false] RESOLVED:[group=team]], [kibana user-> RULES:[auth_key_sha512->false] RESOLVED:[group=team]], [apm_central_config-> RULES:[auth_key_sha512->false] RESOLVED:[group=team]], [Access delete doc-> RULES:[ldap_authentication->true, actions->false] RESOLVED:[user=user;group=team]], [China user-> RULES:[ldap_authentication->true, ldap_authorization->true, kibana_hide_apps->true, kibana_access->true, indices->true] RESOLVED:[user=user;group=team;av_groups=ACL-APP-Kibana-NO-PII;kibana_idx=.kibana]], [China elevated user-> RULES:[ldap_authentication->true, ldap_authorization->true, kibana_hide_apps->true, kibana_access->true, indices->true] RESOLVED:[user=user;group=team;av_groups=ACL-APP-Kibana-NO-PII, ACL-APP-Kibana-Elevated Users;kibana_idx=.kibana]], [China error message-> RULES:[ldap_authentication->true, ldap_authorization->true] RESOLVED:[user=user;group=team;av_groups=ACL-APP-Kibana-NO-PII]], [Allow Kibana and regular indices access for AD users in ACL-APP-Kibana-Elevated Users-> RULES:[ldap_authentication->true, ldap_authorization->true, kibana_hide_apps->true, kibana_access->true] RESOLVED:[user=user;group=team;av_groups=ACL-APP-Kibana-Elevated Users;kibana_idx=.kibana]], [Basic Kibana and regular indices access for all RCOffice users-> RULES:[ldap_authentication->true, ldap_authorization->true, kibana_hide_apps->true, kibana_access->true] RESOLVED:[user=user;group=team;av_groups=ACL-APP-EU-Kibana;kibana_idx=.kibana]], [LOCALHOST-only access-> RULES:[hosts->true, headers_and->false] RESOLVED:[group=team]], [user is in ldap but not in basic group-> RULES:[ldap_authentication->true] RESOLVED:[user=user;group=team]], }
error log elasticsearch:
[2025-07-10T17:33:57,135][DEBUG][o.e.a.s.TransportSearchAction] [host][puzy_lAETOqfkjZy7Qp6hQ][index][8]: Failed to execute [SearchRequest{searchType=QUERY_THEN_FETCH, indices=[*:*-logs-*], indicesOptions=IndicesOptions[ignore_unavailable=true, allow_no_indices=true, expand_wildcards_open=true, expand_wildcards_closed=false, expand_wildcards_hidden=false, allow_aliases_to_multiple_indices=true, forbid_closed_indices=true, ignore_aliases=false, ignore_throttled=true], types=[], routing='null', preference='null', requestCache=true, scroll=null, maxConcurrentShardRequests=0, batchedReduceSize=64, preFilterShardSize=1, allowPartialSearchResults=true, localClusterAlias=null, getOrCreateAbsoluteStartMillis=-1, ccsMinimizeRoundtrips=false, enableFieldsEmulation=true, source={"size":0,"query":{"bool":{"filter":[{"range":{"log.timestamp":{"from":"2025-07-10T17:18:55.305Z","to":"2025-07-10T17:33:55.305Z","include_lower":true,"include_upper":true,"format":"strict_date_optional_time","boost":1.0}}}],"adjust_pure_negative":true,"boost":1.0}},"stored_fields":"*","script_fields":{},"track_total_hits":2147483647,"aggregations":{"2":{"date_histogram":{"field":"log.timestamp","time_zone":"UTC","fixed_interval":"30s","offset":0,"order":{"_key":"asc"},"keyed":false,"min_doc_count":1}}}}}] lastShard [true]
org.elasticsearch.transport.SendRequestTransportException: [datanoda][1.1.1.1:9300][indices:data/read/search[phase/query]]
	at org.elasticsearch.transport.TransportService.sendRequest(TransportService.java:881) [elasticsearch-7.17.25.jar:7.17.25]
	at org.elasticsearch.transport.TransportService.sendChildRequest(TransportService.java:937) [elasticsearch-7.17.25.jar:7.17.25]
	at org.elasticsearch.transport.TransportService.sendChildRequest(TransportService.java:925) [elasticsearch-7.17.25.jar:7.17.25]
	at org.elasticsearch.action.search.SearchTransportService.sendExecuteQuery(SearchTransportService.java:250) [elasticsearch-7.17.25.jar:7.17.25]
	at org.elasticsearch.action.search.SearchQueryThenFetchAsyncAction.executePhaseOnShard(SearchQueryThenFetchAsyncAction.java:104) [elasticsearch-7.17.25.jar:7.17.25]
	at org.elasticsearch.action.search.AbstractSearchAsyncAction.lambda$performPhaseOnShard$3(AbstractSearchAsyncAction.java:316) [elasticsearch-7.17.25.jar:7.17.25]
	at org.elasticsearch.action.search.AbstractSearchAsyncAction$PendingExecutions.tryRun(AbstractSearchAsyncAction.java:843) [elasticsearch-7.17.25.jar:7.17.25]
	at org.elasticsearch.action.search.AbstractSearchAsyncAction.performPhaseOnShard(AbstractSearchAsyncAction.java:350) [elasticsearch-7.17.25.jar:7.17.25]
	at org.elasticsearch.action.search.AbstractSearchAsyncAction.onShardFailure(AbstractSearchAsyncAction.java:505) [elasticsearch-7.17.25.jar:7.17.25]
	at org.elasticsearch.action.search.AbstractSearchAsyncAction.access$000(AbstractSearchAsyncAction.java:64) [elasticsearch-7.17.25.jar:7.17.25]
	at org.elasticsearch.action.search.AbstractSearchAsyncAction$1.onFailure(AbstractSearchAsyncAction.java:331) [elasticsearch-7.17.25.jar:7.17.25]
	at org.elasticsearch.action.ActionListener$Delegating.onFailure(ActionListener.java:66) [elasticsearch-7.17.25.jar:7.17.25]
	at org.elasticsearch.action.ActionListenerResponseHandler.handleException(ActionListenerResponseHandler.java:48) [elasticsearch-7.17.25.jar:7.17.25]
	at org.elasticsearch.action.search.SearchTransportService$ConnectionCountingHandler.handleException(SearchTransportService.java:651) [elasticsearch-7.17.25.jar:7.17.25]
	at org.elasticsearch.transport.TransportService$4.handleException(TransportService.java:853) [elasticsearch-7.17.25.jar:7.17.25]
	at org.elasticsearch.transport.TransportService$ContextRestoreResponseHandler.handleException(TransportService.java:1481) [elasticsearch-7.17.25.jar:7.17.25]
	at org.elasticsearch.transport.InboundHandler.lambda$handleException$3(InboundHandler.java:380) [elasticsearch-7.17.25.jar:7.17.25]
	at org.elasticsearch.common.util.concurrent.EsExecutors$DirectExecutorService.execute(EsExecutors.java:291) [elasticsearch-7.17.25.jar:7.17.25]
	at org.elasticsearch.transport.InboundHandler.handleException(InboundHandler.java:378) [elasticsearch-7.17.25.jar:7.17.25]
	at org.elasticsearch.transport.InboundHandler.handlerResponseError(InboundHandler.java:370) [elasticsearch-7.17.25.jar:7.17.25]
	at org.elasticsearch.transport.InboundHandler.messageReceived(InboundHandler.java:134) [elasticsearch-7.17.25.jar:7.17.25]
	at org.elasticsearch.transport.InboundHandler.inboundMessage(InboundHandler.java:88) [elasticsearch-7.17.25.jar:7.17.25]
	at org.elasticsearch.transport.TcpTransport.inboundMessage(TcpTransport.java:746) [elasticsearch-7.17.25.jar:7.17.25]
	at org.elasticsearch.transport.InboundPipeline.forwardFragments(InboundPipeline.java:147) [elasticsearch-7.17.25.jar:7.17.25]
	at org.elasticsearch.transport.InboundPipeline.doHandleBytes(InboundPipeline.java:119) [elasticsearch-7.17.25.jar:7.17.25]
	at org.elasticsearch.transport.InboundPipeline.handleBytes(InboundPipeline.java:84) [elasticsearch-7.17.25.jar:7.17.25]
	at org.elasticsearch.transport.netty4.Netty4MessageChannelHandler.channelRead(Netty4MessageChannelHandler.java:71) [transport-netty4-client-7.17.25.jar:7.17.25]
	at io.netty.channel.AbstractChannelHandlerContext.invokeChannelRead(AbstractChannelHandlerContext.java:442) [netty-transport-4.1.94.Final.jar:4.1.94.Final]
	at io.netty.channel.AbstractChannelHandlerContext.invokeChannelRead(AbstractChannelHandlerContext.java:420) [netty-transport-4.1.94.Final.jar:4.1.94.Final]
	at io.netty.channel.AbstractChannelHandlerContext.fireChannelRead(AbstractChannelHandlerContext.java:412) [netty-transport-4.1.94.Final.jar:4.1.94.Final]
	at io.netty.handler.logging.LoggingHandler.channelRead(LoggingHandler.java:280) [netty-handler-4.1.94.Final.jar:4.1.94.Final]
	at io.netty.channel.AbstractChannelHandlerContext.invokeChannelRead(AbstractChannelHandlerContext.java:442) [netty-transport-4.1.94.Final.jar:4.1.94.Final]
	at io.netty.channel.AbstractChannelHandlerContext.invokeChannelRead(AbstractChannelHandlerContext.java:420) [netty-transport-4.1.94.Final.jar:4.1.94.Final]
	at io.netty.channel.AbstractChannelHandlerContext.fireChannelRead(AbstractChannelHandlerContext.java:412) [netty-transport-4.1.94.Final.jar:4.1.94.Final]
	at io.netty.handler.codec.MessageToMessageDecoder.channelRead(MessageToMessageDecoder.java:103) [netty-codec-4.1.94.Final.jar:4.1.94.Final]
	at io.netty.channel.AbstractChannelHandlerContext.invokeChannelRead(AbstractChannelHandlerContext.java:444) [netty-transport-4.1.94.Final.jar:4.1.94.Final]
	at io.netty.channel.AbstractChannelHandlerContext.invokeChannelRead(AbstractChannelHandlerContext.java:420) [netty-transport-4.1.94.Final.jar:4.1.94.Final]
	at io.netty.channel.AbstractChannelHandlerContext.fireChannelRead(AbstractChannelHandlerContext.java:412) [netty-transport-4.1.94.Final.jar:4.1.94.Final]
	at io.netty.channel.DefaultChannelPipeline$HeadContext.channelRead(DefaultChannelPipeline.java:1410) [netty-transport-4.1.94.Final.jar:4.1.94.Final]
	at io.netty.channel.AbstractChannelHandlerContext.invokeChannelRead(AbstractChannelHandlerContext.java:440) [netty-transport-4.1.94.Final.jar:4.1.94.Final]
	at io.netty.channel.AbstractChannelHandlerContext.invokeChannelRead(AbstractChannelHandlerContext.java:420) [netty-transport-4.1.94.Final.jar:4.1.94.Final]
	at io.netty.channel.DefaultChannelPipeline.fireChannelRead(DefaultChannelPipeline.java:919) [netty-transport-4.1.94.Final.jar:4.1.94.Final]
	at io.netty.channel.nio.AbstractNioByteChannel$NioByteUnsafe.read(AbstractNioByteChannel.java:166) [netty-transport-4.1.94.Final.jar:4.1.94.Final]
	at io.netty.channel.nio.NioEventLoop.processSelectedKey(NioEventLoop.java:788) [netty-transport-4.1.94.Final.jar:4.1.94.Final]
	at io.netty.channel.nio.NioEventLoop.processSelectedKeysPlain(NioEventLoop.java:689) [netty-transport-4.1.94.Final.jar:4.1.94.Final]
	at io.netty.channel.nio.NioEventLoop.processSelectedKeys(NioEventLoop.java:652) [netty-transport-4.1.94.Final.jar:4.1.94.Final]
	at io.netty.channel.nio.NioEventLoop.run(NioEventLoop.java:562) [netty-transport-4.1.94.Final.jar:4.1.94.Final]
	at io.netty.util.concurrent.SingleThreadEventExecutor$4.run(SingleThreadEventExecutor.java:997) [netty-common-4.1.94.Final.jar:4.1.94.Final]
	at io.netty.util.internal.ThreadExecutorMap$2.run(ThreadExecutorMap.java:74) [netty-common-4.1.94.Final.jar:4.1.94.Final]
	at java.lang.Thread.run(Thread.java:829) [?:?]
Caused by: org.elasticsearch.tasks.TaskCancelledException: parent task was cancelled [fatal failure: unable to store initial response]
	at org.elasticsearch.tasks.TaskManager$CancellableTaskHolder.registerChildConnection(TaskManager.java:579) ~[elasticsearch-7.17.25.jar:7.17.25]
	at org.elasticsearch.tasks.TaskManager.registerChildConnection(TaskManager.java:213) ~[elasticsearch-7.17.25.jar:7.17.25]
	at org.elasticsearch.transport.TransportService.sendRequest(TransportService.java:842) ~[elasticsearch-7.17.25.jar:7.17.25]
	... 49 more
error log kibana
{"type":"response","@timestamp":"2025-07-10T17:37:58+00:00","tags":[],"pid":3043803,"method":"post","statusCode":200,"req":{"url":"/internal/bsearch?compress=true","method":"post","headers":{"x-forwarded-for":"10.13.15.159","x-passed-nginx":"true","host":"kibana","user-agent":"Mozilla/5.0 (Macintosh; Intel Mac OS X 10.15; rv:138.0) Gecko/20100101 Firefox/138.0","accept":"*/*","accept-language":"ru-RU,ru;q=0.8,en-US;q=0.5,en;q=0.3","accept-encoding":"gzip, deflate","referer":"http://host/s/default/app/discover","content-type":"application/json","kbn-version":"7.17.25","origin":"http://host","connection":"keep-alive","keep-alive":"timeout=10, max=1000","x-ror-pkp-kibana-token":"app096mn5w719lgcieoqhuialm9u0y","x-ror-kibana-index":".kibana","content-length":"1850","accept-charset":"utf-8"},"remoteAddress":"127.0.0.1","userAgent":"Mozilla/5.0 (Macintosh; Intel Mac OS X 10.15; rv:138.0) Gecko/20100101 Firefox/138.0","referer":"http://host/s/default/app/discover"},"res":{"statusCode":200,"responseTime":860},"message":"POST /internal/bsearch?compress=true 200 860ms"}
[17:37:59:197] [info][plugins][ReadonlyREST][authorizationHeadersValidation][x-ror-correlation-id=7779bbd2-866f-4285-b050-66d1629a0605] Current session successfully revalidated against ES
[17:37:59:198] [info][plugins][ReadonlyREST][authorizationHeadersValidation][x-ror-correlation-id=7779bbd2-866f-4285-b050-66d1629a0605] Current session successfully revalidated against ES
minimum ror config
readonlyrest:
    prompt_for_basic_auth: false
    response_if_req_forbidden: Wrong password or try clearing your browser cache

access_control_rules:
    - name: "Allow unrestricted access to team users"
      type: allow
      ldap_authentication:
        name: "ldap"
      ldap_authorization:
        name: "ldap"
        groups: ["team"]
      kibana_access: unrestricted

    - name: "user is in ldap but not in basic group"
      type:
        policy: forbid
        response_message: "forbid"
      ldap_authentication:
        name: "ldap"
What I tried:
1)If I change ElasticSearch to another server in kibana.yml, the error is transferred to the logs of another node.
2)Kibana restart doesn’t help and Elasticsearch
3)Remove from ROR acl
name: “user is in ldap but not in basic group”
I get an error : Wrong password or try clearing your browser cache
4)Create a local user, the error persists
5)There is another Kibana in this cluster with exactly the same settings. We installed it with one playbook. It works without errors.
I want the local user and the user with the team group to have access to the logs
{“customer_id”: “6c4a385b-2ae8-4f02-a9cd-ef24addfb5b3”, “subscription_id”: “32d4073f-dc2f-4056-a868-842727c637cd”}