Kibana logs out after opening SIEM page

Upgrade from 6.x to 7.3.2. Everything works except the SIEM tab. When ever I go to the SIEM tab, I get logged out and redirected to the login page. I’m not using and proxy in front, so thats not the problem.

Elasticsearch/Kibana version: 7.3.2

The logs output this error.

Oct 29 11:19:52 PRESC01 kibana[92260]: { Error: Not Found
Oct 29 11:19:52 PRESC01 kibana[92260]: at handler (/usr/share/kibana/src/legacy/server/http/index.js:113:29)
Oct 29 11:19:52 PRESC01 kibana[92260]: at module.exports.internals.Manager.execute (/usr/share/kibana/node_modules/hapi/lib/toolkit.js:35:106)
Oct 29 11:19:52 PRESC01 kibana[92260]: at Object.internals.handler (/usr/share/kibana/node_modules/hapi/lib/handler.js:50:48)
Oct 29 11:19:52 PRESC01 kibana[92260]: at exports.execute (/usr/share/kibana/node_modules/hapi/lib/handler.js:35:36)
Oct 29 11:19:52 PRESC01 kibana[92260]: at Request._lifecycle (/usr/share/kibana/node_modules/hapi/lib/request.js:263:62)
Oct 29 11:19:52 PRESC01 kibana[92260]: data: null,
Oct 29 11:19:52 PRESC01 kibana[92260]: isBoom: true,
Oct 29 11:19:52 PRESC01 kibana[92260]: isServer: false,
Oct 29 11:19:52 PRESC01 kibana[92260]: output:
Oct 29 11:19:52 PRESC01 kibana[92260]: { statusCode: 404,
Oct 29 11:19:52 PRESC01 kibana[92260]: payload:
Oct 29 11:19:52 PRESC01 kibana[92260]: { statusCode: 404, error: 'Not Found', message: 'Not Found' },
Oct 29 11:19:52 PRESC01 kibana[92260]: headers:
Oct 29 11:19:52 PRESC01 kibana[92260]: { 'kbn-name': 'kibana',
Oct 29 11:19:52 PRESC01 kibana[92260]: 'kbn-xpack-sig': '37fa0a487b714a7c397e35e10c1b1322' } },
Oct 29 11:19:52 PRESC01 kibana[92260]: reformat: [Function],
Oct 29 11:19:52 PRESC01 kibana[92260]: message: 'Not Found',
Oct 29 11:19:52 PRESC01 kibana[92260]: typeof: [Function: notFound] }
Oct 29 11:19:52 PRESC01 kibana[92260]: redirecting to  /login

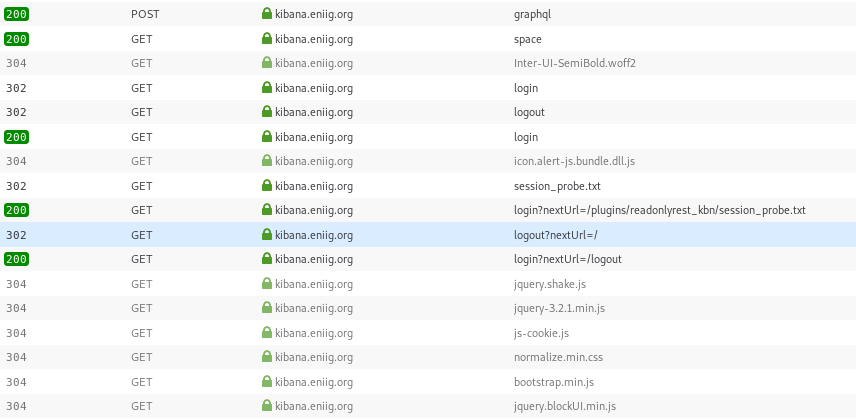
The WebUI briefly show this:

  JSON.parse: unexpected character at line 1 column 1 of the JSON data

Any ideas why the SIEM tab does not work?..

Here’s a screenshot from the developer tab.

Can confirm on Kibana v 7.3.2, ROR enterprise-1.18.7_es7.3.2
Same as APM app.

Do you need any logs?

Im on: ReadonlyREST Security version pro-1.18.7_es7.3.2

Thanks for the feedback guys, can you check if Elasticsearch has some FORBIDDEN log lines or anything interesting when you experience this?

Nope… literally nothing shows

I just tried with version enterprise-1.18.8-20191109_es7.3.2 using our docker image, it works well. Both in “admin” and “rw” kibana access mode.

Here’s my access_control_rules.

    - name: IT - RW ALL
      type: allow
      kibana_access: admin
      ldap_auth:
          name: "ldap1"
          groups: ["admin-group"]
      verbosity: error # don't log successful request

yeah it’s functionally the same. Can you reproduce with 1.18.8?

Just upgraded to ES 7.4.2 and ROR 1.18.9 and the error still occurs. Nothing has changed.

A fresh stack trace.

Dec 10 09:04:14 PRESC01 kibana[7601]: { Error: Not Found
Dec 10 09:04:14 PRESC01 kibana[7601]: at handler (/usr/share/kibana/src/legacy/server/http/index.js:113:29)
Dec 10 09:04:14 PRESC01 kibana[7601]: at module.exports.internals.Manager.execute (/usr/share/kibana/node_modules/hapi/lib/toolkit.js:35:106)
Dec 10 09:04:14 PRESC01 kibana[7601]: at Object.internals.handler (/usr/share/kibana/node_modules/hapi/lib/handler.js:50:48)
Dec 10 09:04:14 PRESC01 kibana[7601]: at exports.execute (/usr/share/kibana/node_modules/hapi/lib/handler.js:35:36)
Dec 10 09:04:14 PRESC01 kibana[7601]: at Request._lifecycle (/usr/share/kibana/node_modules/hapi/lib/request.js:263:62)
Dec 10 09:04:14 PRESC01 kibana[7601]: data: null,
Dec 10 09:04:14 PRESC01 kibana[7601]: isBoom: true,
Dec 10 09:04:14 PRESC01 kibana[7601]: isServer: false,
Dec 10 09:04:14 PRESC01 kibana[7601]: output:
Dec 10 09:04:14 PRESC01 kibana[7601]: { statusCode: 404,
Dec 10 09:04:14 PRESC01 kibana[7601]: payload:
Dec 10 09:04:14 PRESC01 kibana[7601]: { statusCode: 404, error: 'Not Found', message: 'Not Found' },
Dec 10 09:04:14 PRESC01 kibana[7601]: headers:
Dec 10 09:04:14 PRESC01 kibana[7601]: { 'kbn-name': 'kibana',
Dec 10 09:04:14 PRESC01 kibana[7601]: 'kbn-xpack-sig': '37fa0a487b714a7c397e35e10c1b1322' } },
Dec 10 09:04:14 PRESC01 kibana[7601]: reformat: [Function],
Dec 10 09:04:14 PRESC01 kibana[7601]: message: 'Not Found',
Dec 10 09:04:14 PRESC01 kibana[7601]: typeof: [Function: notFound] }
Dec 10 09:04:14 PRESC01 kibana[7601]: redirecting to  /login

@sscarduzio Its not just the SIEM page… Its a bit random on different pages.

yep it seems related to the same thing I posted.

@ld57 Posted where ?

in the forum.

i think it is related to error response interpretation

Found a fix, will publish a pre.

@all the builds are ready, please DM me and tell me for what Kibana version you need!

1 Like

I tested on my side the siem module, with the 1.18.10-pre1

there is no more kick out to login screen, this is fixed

1 Like

Nice… When can we expect it on the download page ? @sscarduzio

@coutoPL WDYT we can release 1.18.10?

yes, IMO we can release 1.18.10

1 Like

Have the same issue, can you sent me the build for 7.4.2 kibana?