This problem come back with our PROD env and new testing env. THIS IS URGENT
ROR 1.16.4
KBN 0.1.5 and KBN 0.1.4
ES 5.4.1 (one master node [T1], one coordinating node [T2], kibana on T2, ROR on T1)
No x-pack
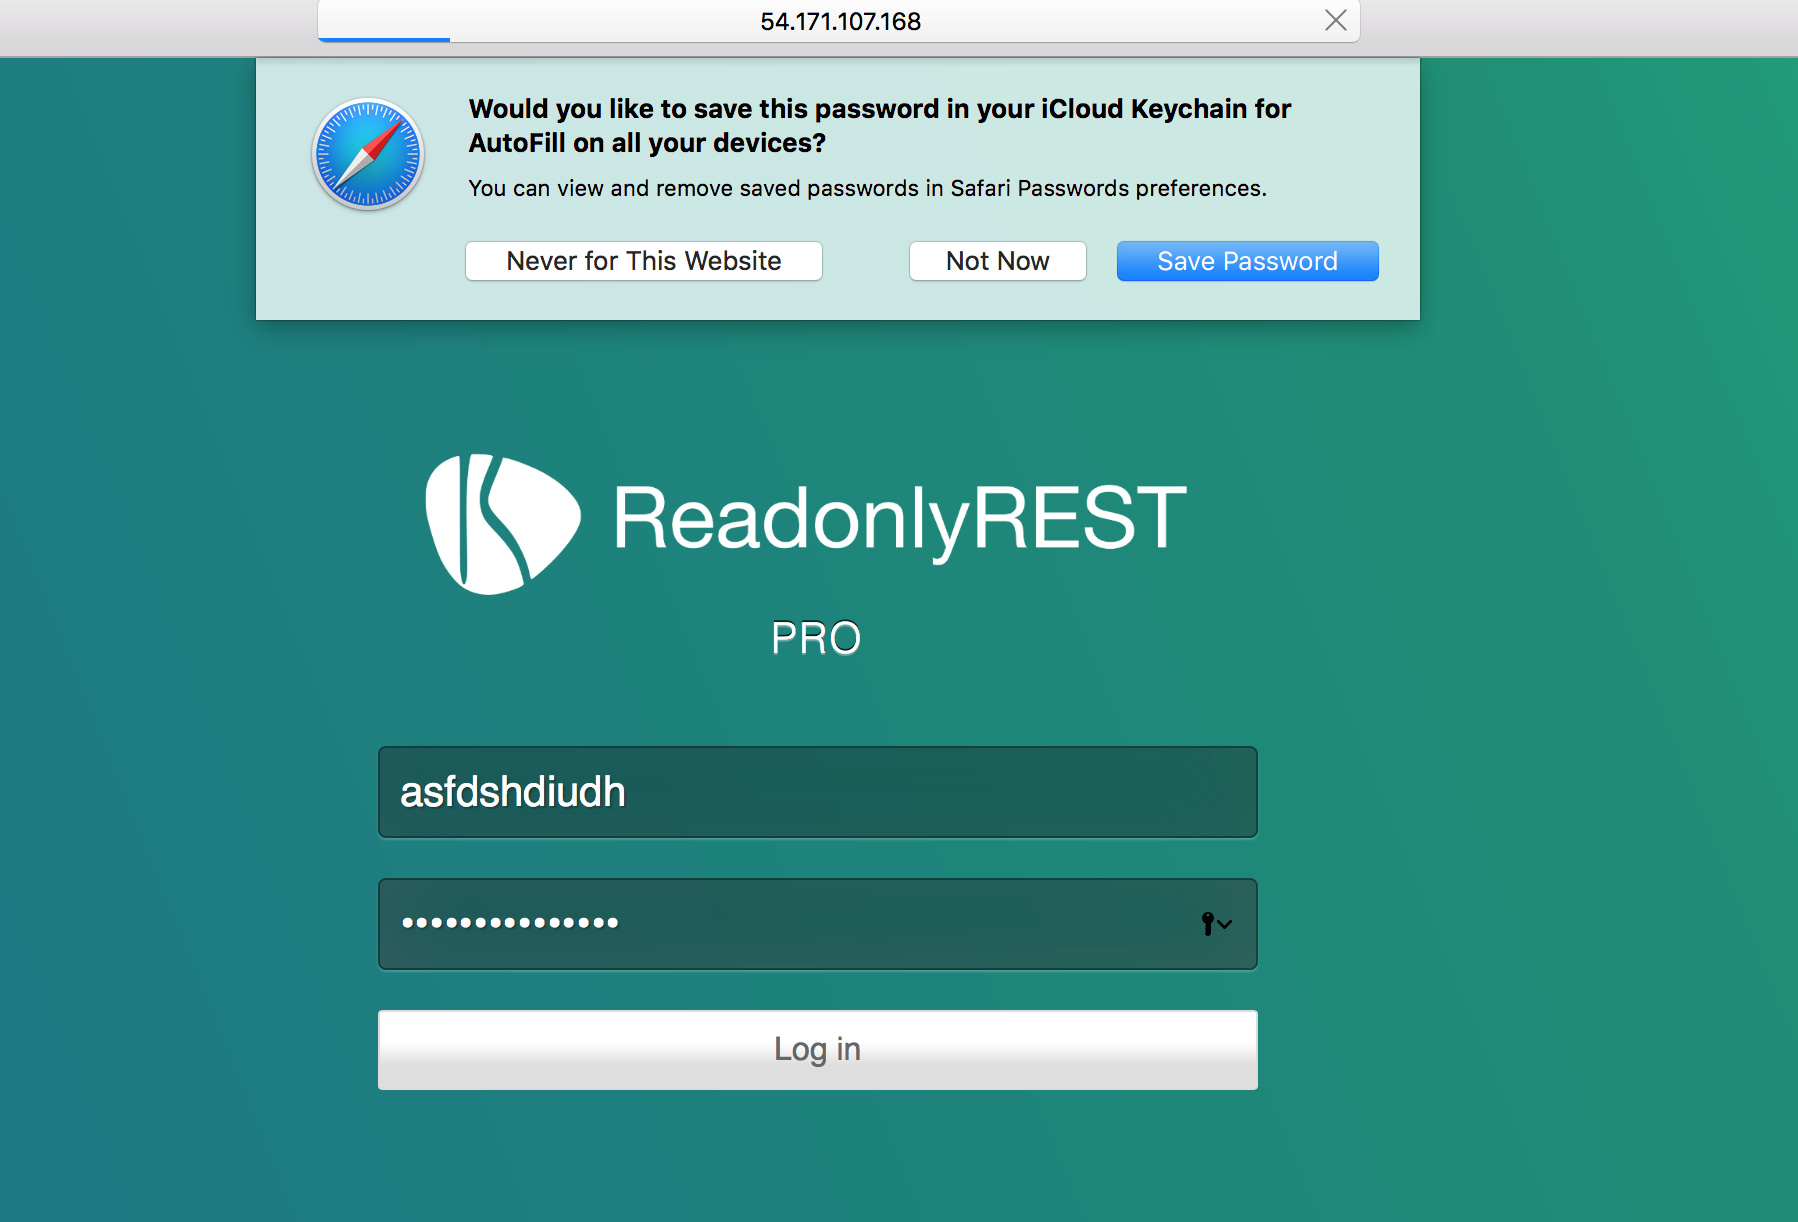
I installed brand new testing env and Kibana is back to the letting all in behavior. No reaction from elasticsearch log when I login to the kibana, with made up user
elasticsearch.yml
readonlyrest:
enable: true
response_if_req_forbidden: Forbidden by ReadonlyREST ES plugin
prompt_for_basic_auth: false
access_control_rules:
- name: "Accept all requests for indices"
type: allow
hosts: ["elastic-t1", "elastic-t2"]
 - name: "Kibana Server"
      type: allow
      auth_key: kibana:kibana
- name: "Dev"
type: allow
kibana_access: ro
kibana_hide_apps: ["timelion","readonlyrest_kbn","monitoring", "kibana:management"]
groups: ["Dev"]
indices: [".kibana", ".kibana-devnull"]
users:
- username: dan
auth_key: dan:dan123
groups: ["Dev"]
- username: anna
auth_key: anna:anna123
groups: ["Dev"]
kibana.yml
server.host: "xx.xxx.xx.x"
server.name: "Kibana"
elasticsearch.url: "http://xx.xxx.xx.x:9200"
elasticsearch.username: "kibana"
elasticsearch.password: "kibana"
elasticsearch.ssl.verificationMode: none
logging.dest: /var/log/kibana/kibana.log
kibana.log
{"type":"log","@timestamp":"2017-06-16T11:52:59Z","tags":["status","plugin:kibana@5.4.1","info"],"pid":13406,"state":"green","message":"Status changed from uninitialized to green - Ready","prevState":"uninitialized","prevMsg":"uninitialized"}
{"type":"log","@timestamp":"2017-06-16T11:53:00Z","tags":["status","plugin:elasticsearch@5.4.1","info"],"pid":13406,"state":"yellow","message":"Status changed from uninitialized to yellow - Waiting for Elasticsearch","prevState":"uninitialized","prevMsg":"uninitialized"}
{"type":"log","@timestamp":"2017-06-16T11:53:00Z","tags":["status","plugin:readonlyrest_kbn@0.1.4","info"],"pid":13406,"state":"green","message":"Status changed from uninitialized to green - Ready","prevState":"uninitialized","prevMsg":"uninitialized"}
{"type":"log","@timestamp":"2017-06-16T11:53:00Z","tags":["status","plugin:console@5.4.1","info"],"pid":13406,"state":"green","message":"Status changed from uninitialized to green - Ready","prevState":"uninitialized","prevMsg":"uninitialized"}
{"type":"log","@timestamp":"2017-06-16T11:53:00Z","tags":["status","plugin:elasticsearch@5.4.1","info"],"pid":13406,"state":"green","message":"Status changed from yellow to green - Kibana index ready","prevState":"yellow","prevMsg":"Waiting for Elasticsearch"}
{"type":"log","@timestamp":"2017-06-16T11:53:00Z","tags":["status","plugin:metrics@5.4.1","info"],"pid":13406,"state":"green","message":"Status changed from uninitialized to green - Ready","prevState":"uninitialized","prevMsg":"uninitialized"}
{"type":"log","@timestamp":"2017-06-16T11:53:00Z","tags":["status","plugin:timelion@5.4.1","info"],"pid":13406,"state":"green","message":"Status changed from uninitialized to green - Ready","prevState":"uninitialized","prevMsg":"uninitialized"}
{"type":"log","@timestamp":"2017-06-16T11:53:00Z","tags":["listening","info"],"pid":13406,"message":"Server running at http://10.0.201.238:5601"}
{"type":"log","@timestamp":"2017-06-16T11:53:00Z","tags":["status","ui settings","info"],"pid":13406,"state":"green","message":"Status changed from uninitialized to green - Ready","prevState":"uninitialized","prevMsg":"uninitialized"}
{"type":"response","@timestamp":"2017-06-16T11:53:22Z","tags":[],"pid":13406,"method":"get","statusCode":302,"req":{"url":"/app/kibana","method":"get","headers":{"host":"54.171.107.168:5601","upgrade-insecure-requests":"1","accept":"text/html,application/xhtml+xml,application/xml;q=0.9,*/*;q=0.8","user-agent":"Mozilla/5.0 (Macintosh; Intel Mac OS X 10_11_6) AppleWebKit/603.2.5 (KHTML, like Gecko) Version/10.1.1 Safari/603.2.5","accept-language":"en-us","accept-encoding":"gzip, deflate","connection":"keep-alive"},"remoteAddress":"185.7.185.182","userAgent":"185.7.185.182"},"res":{"statusCode":302,"responseTime":15,"contentLength":9},"message":"GET /app/kibana 302 15ms - 9.0B"}
{"type":"response","@timestamp":"2017-06-16T11:53:22Z","tags":[],"pid":13406,"method":"get","statusCode":200,"req":{"url":"/login?nextUrl=%2Fapp%2Fkibana","method":"get","headers":{"host":"54.171.107.168:5601","upgrade-insecure-requests":"1","accept":"text/html,application/xhtml+xml,application/xml;q=0.9,*/*;q=0.8","user-agent":"Mozilla/5.0 (Macintosh; Intel Mac OS X 10_11_6) AppleWebKit/603.2.5 (KHTML, like Gecko) Version/10.1.1 Safari/603.2.5","accept-language":"en-us","accept-encoding":"gzip, deflate","connection":"keep-alive"},"remoteAddress":"185.7.185.182","userAgent":"185.7.185.182"},"res":{"statusCode":200,"responseTime":11,"contentLength":9},"message":"GET /login?nextUrl=%2Fapp%2Fkibana 200 11ms - 9.0B"}
{"type":"response","@timestamp":"2017-06-16T11:53:22Z","tags":[],"pid":13406,"method":"get","statusCode":304,"req":{"url":"/plugins/timelion/icon.svg","method":"get","headers":{"host":"54.171.107.168:5601","connection":"keep-alive","if-none-match":"\"cb793d5314d680b7d5ce130f0393a70b51989541-gzip\"","accept":"image/png,image/svg+xml,image/*;q=0.8,*/*;q=0.5","if-modified-since":"Mon, 29 May 2017 16:20:01 GMT","user-agent":"Mozilla/5.0 (Macintosh; Intel Mac OS X 10_11_6) AppleWebKit/603.2.5 (KHTML, like Gecko) Version/10.1.1 Safari/603.2.5","accept-language":"en-us","referer":"http://54.171.107.168:5601/app/kibana","accept-encoding":"gzip, deflate"},"remoteAddress":"185.7.185.182","userAgent":"185.7.185.182","referer":"http://54.171.107.168:5601/app/kibana"},"res":{"statusCode":304,"responseTime":10,"contentLength":9},"message":"GET /plugins/timelion/icon.svg 304 10ms - 9.0B"}
{"type":"response","@timestamp":"2017-06-16T11:53:22Z","tags":[],"pid":13406,"method":"get","statusCode":304,"req":{"url":"/plugins/kibana/assets/wrench.svg","method":"get","headers":{"host":"54.171.107.168:5601","connection":"keep-alive","if-none-match":"\"088a9a98c99e406dca2354af14f688ad84826b97-gzip\"","accept":"image/png,image/svg+xml,image/*;q=0.8,*/*;q=0.5","if-modified-since":"Mon, 29 May 2017 16:20:01 GMT","user-agent":"Mozilla/5.0 (Macintosh; Intel Mac OS X 10_11_6) AppleWebKit/603.2.5 (KHTML, like Gecko) Version/10.1.1 Safari/603.2.5","accept-language":"en-us","referer":"http://54.171.107.168:5601/app/kibana","accept-encoding":"gzip, deflate"},"remoteAddress":"185.7.185.182","userAgent":"185.7.185.182","referer":"http://54.171.107.168:5601/app/kibana"},"res":{"statusCode":304,"responseTime":11,"contentLength":9},"message":"GET /plugins/kibana/assets/wrench.svg 304 11ms - 9.0B"}
{"type":"response","@timestamp":"2017-06-16T11:53:22Z","tags":[],"pid":13406,"method":"get","statusCode":304,"req":{"url":"/bundles/0cebf3d61338c454670b1c5bdf5d6d8d.svg","method":"get","headers":{"host":"54.171.107.168:5601","connection":"keep-alive","if-none-match":"\"d52234e52fd4e96d20f52f4c03c0cedb8ab5fe17-gzip\"","accept":"image/png,image/svg+xml,image/*;q=0.8,*/*;q=0.5","if-modified-since":"Fri, 16 Jun 2017 11:13:31 GMT","user-agent":"Mozilla/5.0 (Macintosh; Intel Mac OS X 10_11_6) AppleWebKit/603.2.5 (KHTML, like Gecko) Version/10.1.1 Safari/603.2.5","accept-language":"en-us","referer":"http://54.171.107.168:5601/app/kibana","accept-encoding":"gzip, deflate"},"remoteAddress":"185.7.185.182","userAgent":"185.7.185.182","referer":"http://54.171.107.168:5601/app/kibana"},"res":{"statusCode":304,"responseTime":12,"contentLength":9},"message":"GET /bundles/0cebf3d61338c454670b1c5bdf5d6d8d.svg 304 12ms - 9.0B"}


 it is going to Prod today