Hi @sscarduzio
“you have multiple kibana instances? Is this HA configuration?“ No, I have multiple kibana instances with its own kibana.index(different saved objects, settings etc.).
Setting ‘verbosity: info’ helped me a little to understand the problem.
When I logged in to kibana I got
[2026-02-07T07:38:24,423][INFO ][t.b.r.a.l.AccessControlListLoggingDecorator] [ES_NODE] ESC[36mALLOWED by { name: '::X LDAP::', policy: ALLOW, rules: [ldap_auth, kibana, indices] req={ ID:XX-XX-XXX-XXX-XXXXXX-XXX#XXXX, TYP:RRUserMetadataRequest, CGR:LDAP_X, USR:XXX, BRS:true, KDX:.kibana-X, ACT:cluster:internal_ror/user_metadata/get, OA:NODE_IP/32, XFF:null, DA:NODE_IP/32, IDX:<N/A>, MET:GET, PTH:/_readonlyrest/metadata/current_user, CNT:<N/A>, HDR:Host=NODE_IP:NODE_PORT, Accept-Encoding=gzip,deflate, Accept=*/*, Connection=keep-alive, User-Agent=node-fetch/1.0 (+https://github.com/bitinn/node-fetch), content-length=0, x-ror-correlation-id=XX-XX-XX-XX-XXXX, tracestate=es=s:0, traceparent=00-XXX-XXX-00, cookie=x-csrf-token-XXXX-session_id=XXXXX; x-csrf-token-XXXX=03XXX.XXXX, Authorization=<OMITTED>,
...
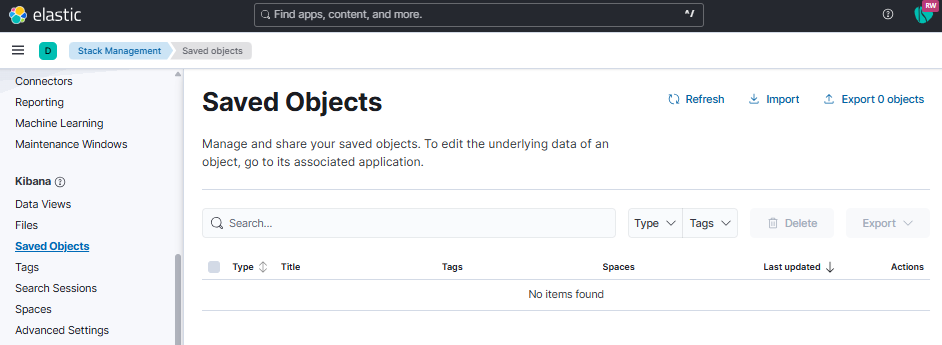
and when I open “Saved objects tab“ I see
and the first log I get is “INDEX NOT FOUND“
[2026-02-07T07:39:20,079][INFO ][t.b.r.a.l.AccessControlListLoggingDecorator] [ES_NODE] ESC[35mINDEX NOT FOUND req={ ID:XX-XX-XXX-XXX-XXXXXX-XXX#XXXX, TYP:SearchRequest, CGR:<N/A>, USR:XXX (attempted), BRS:true, KDX:null, ACT:indices:data/read/search, OA:NODE_IP/32, XFF:X_IP, DA:NODE_IP/32, IDX:.kibana-X,.kibana-X_analytics_8.19.7,.kibana_alerting_cases_8.19.7,.kibana_security_solution_8.19.7, MET:POST, PTH:/.kibana-X,.kibana-X_analytics_8.19.7,.kibana_alerting_cases_8.19.7,.kibana_security_solution_8.19.7/_search, CNT:<OMITTED, LENGTH=4911.0 B> , HDR:x-opaque-id=unknownId, x-ror-kibana-index=.kibana-X, x-elastic-product-origin=kibana, x-ror-kibana-request-path=/s/default/api/kibana/management/saved_objects/scroll/counts, tracestate=es=s:0, Host=NODE_IP:NODE_PORT, accept=application/vnd.elasticsearch+json; compatible-with=8, content-type=application/vnd.elasticsearch+json; compatible-with=8, x-ror-correlation-id=XX-XX-XX-XX-XXXX, user-agent=Kibana/8.19.7, keep-alive=timeout=10, max=1000, connection=keep-alive, Accept-Charset=utf-8, x-forwarded-for=X_IP, traceparent=XX-XXXX-XXXX-00, Content-Length=4911, x-ror-kibana-request-method=post, x-elastic-client-meta=es=8.19.1,js=22.17.1,t=8.9.6,hc=22.17.1, cookie=x-csrf-token-XXXX-session_id=XXXXXX; x-csrf-token-XXXXX.XXXXX, Authorization=<OMITTED>, HIS:[FIRST_ROR_CONFIG_BLOCK-> RULES:[hosts->false] RESOLVED:[indices=.kibana-X, .kibana-X_analytics_8.19.7, .kibana_alerting_cases_8.19.7, .kibana_security_solution_8.19.7]],
...
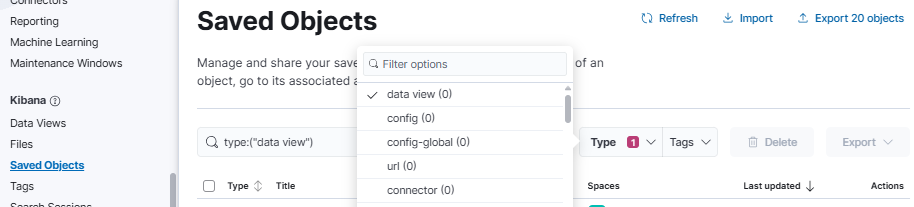
But still being logged in kibana I can filter saved objects
and I get all with matched ‘type’, even though in logs there are another “INDEX NOT FOUND“