Audit log default dashboards
As a follow up of a discussion with @askids
Some time ago we created a proof of concept in which we got inspiration from the “load sample data” cards you see in the vanilla Kibana:
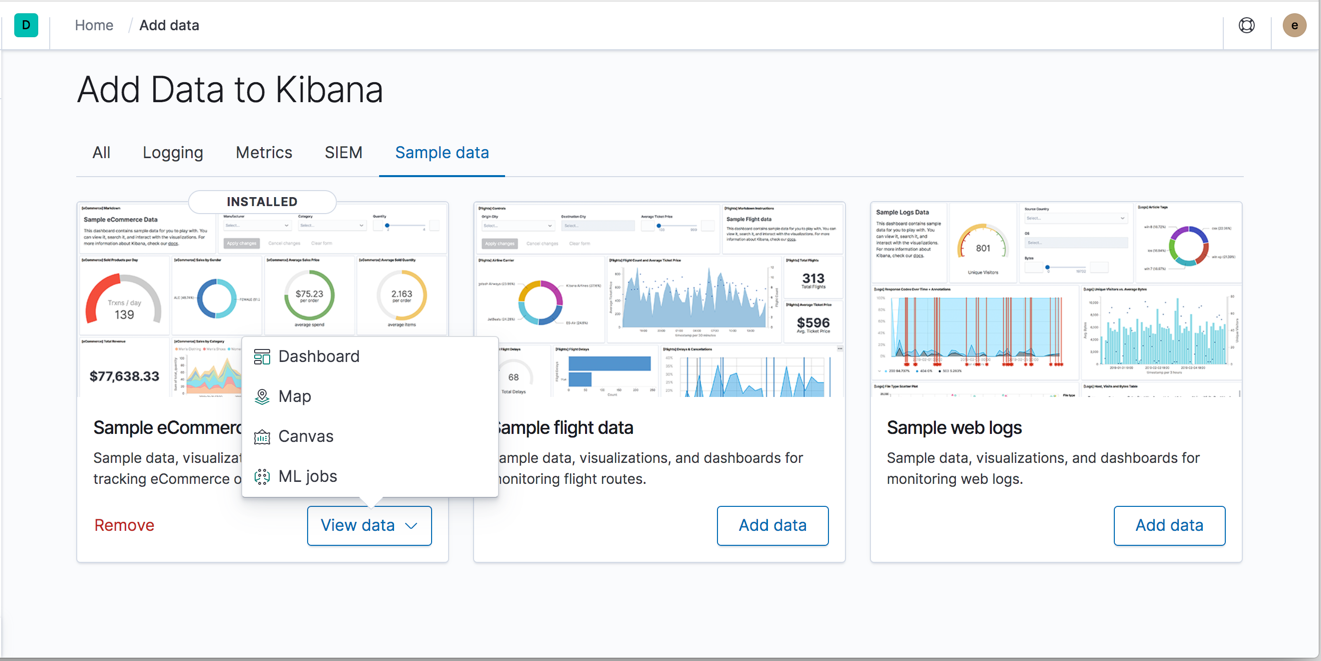
And created a ROR audit dashboard card with a button to automatically:
- Create an index pattern
readonlyrest-audit-* - Create some basic visualizations in a sample dashboard
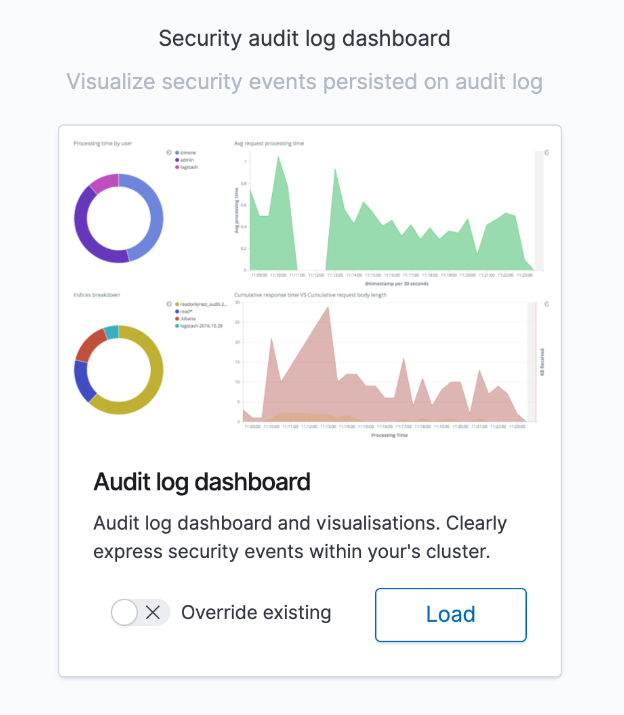
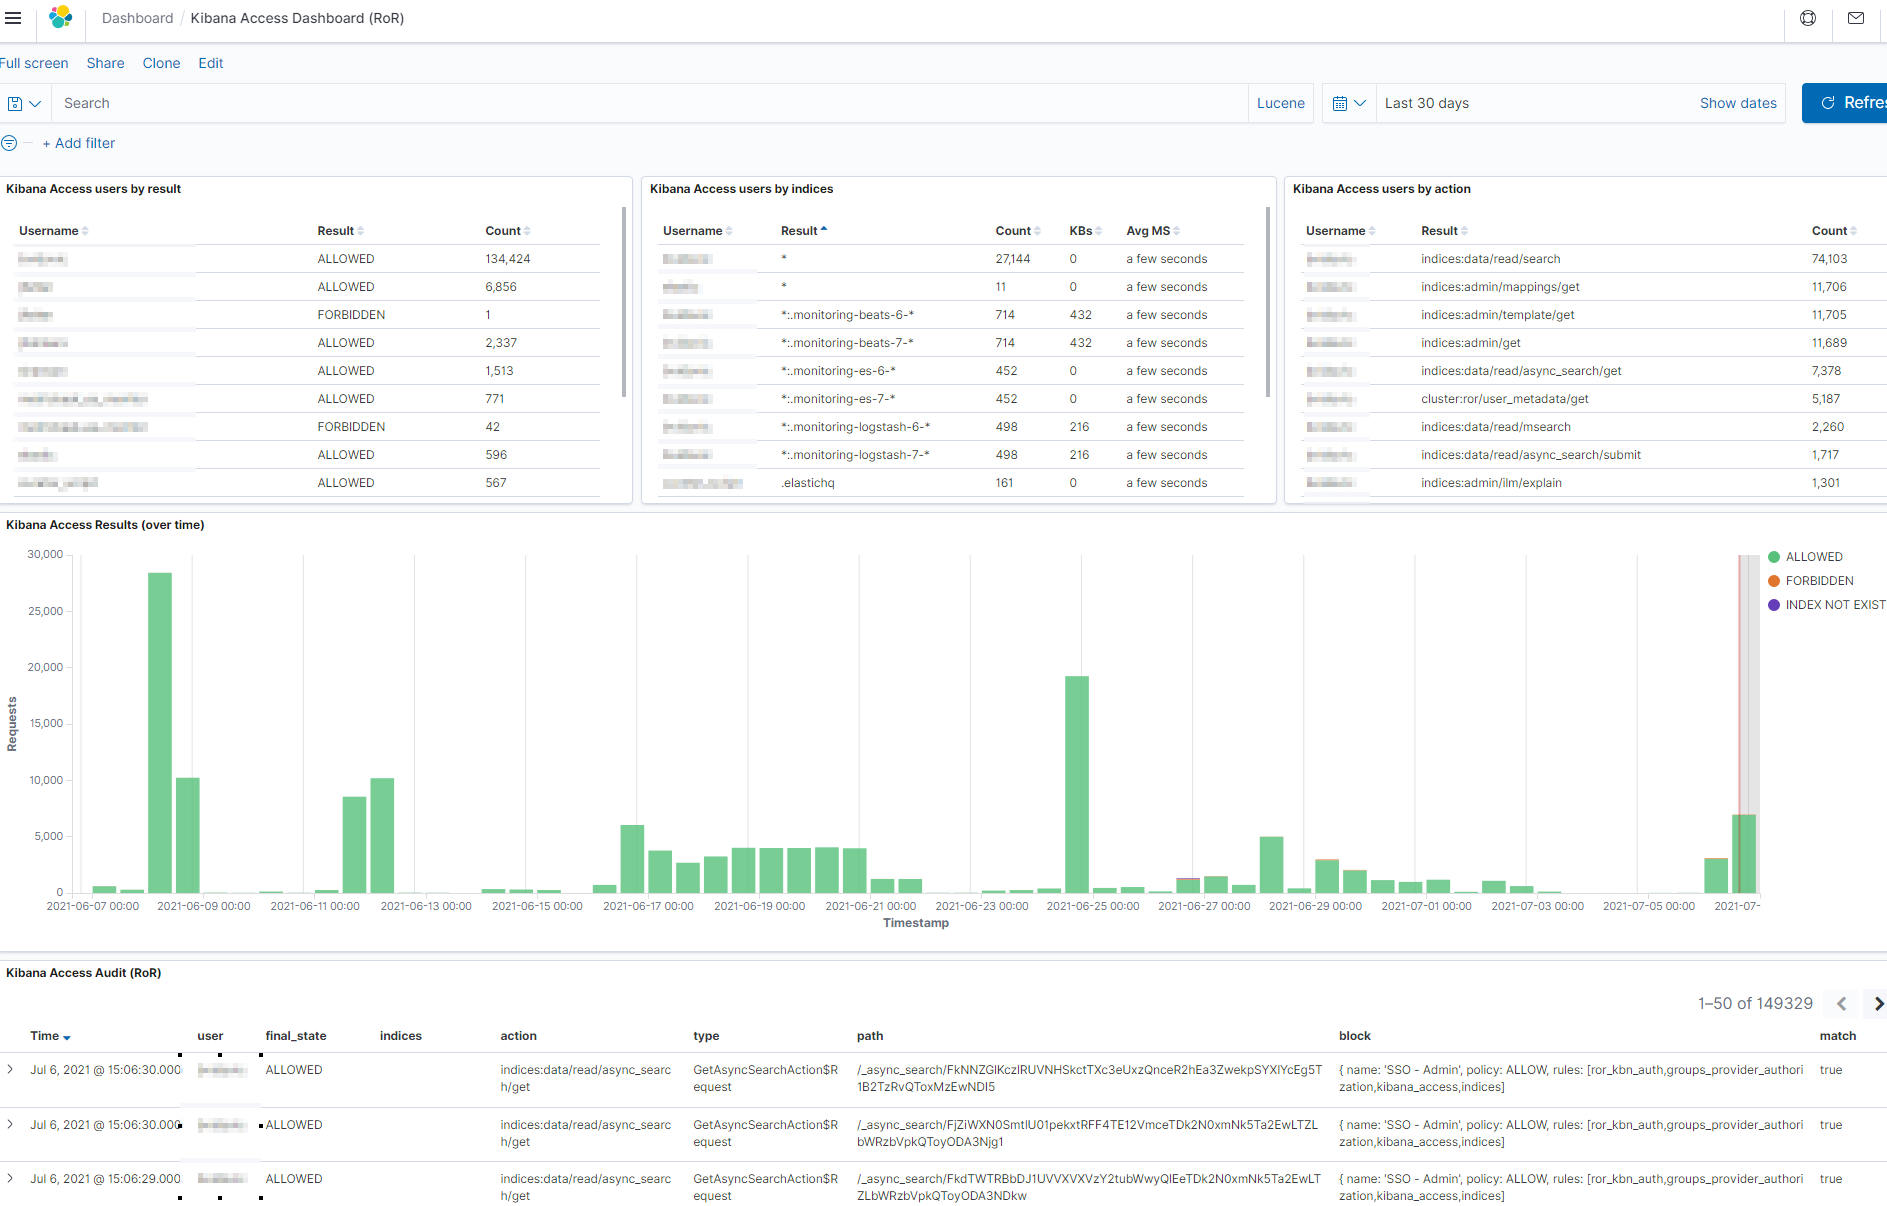
The resulting dashboard contained some very basic example of the insights that can be obtained from the default ROR audit log data points.
I.e.
- Processing time (time of response - time of request)
- Stats on what indices are hit most
- Breakdown on what users hog most resources (cumulative req. processing time per user)
- Authentication failures graph
- Actions breakdown
From what I can see, the data we are able to extract from ROR can be worth under at least two main aspects: security audit, and performance audit.
So I was thinking to maybe create two canned dashboards. But because I know our customers tend to be much more knowledgeable than us, thanks to their day to day experience with the product, I would like to open this task to ideas and dashboards contribution to the forum.
 Open questions for ROR users!
Given the list of fields we collect in ROR audit logs:
    "headers": [
      "Host",
      "Connection",
      "Content-Length",
      "Authorization"
    ],
    "acl_history": "[KIBANA_SERVER-> RULES:[auth_key->false]], [PERSONAL_GRP-> RULES:[groups->false]], [ADMIN_GRP-> RULES:[groups->true, kibana_access->true], RESOLVED:[user=admin;group=Administrators;av_groups=Administrators]], [Infosec-> RULES:[groups->true, kibana_access->false], RESOLVED:[user=admin;group=Infosec;av_groups=Infosec]]",
    "origin": "127.0.0.1/32",
    "match": true,
    "final_state": "ALLOWED",
    "destination": "127.0.0.1/32",
    "task_id": 5383,
    "type": "RRAdminRequest",
    "req_method": "GET",
    "path": "/_readonlyrest/admin/config",
    "indices": [],
    "@timestamp": "2020-05-18T14:10:12Z",
    "content_len_kb": 0,
    "processingMillis": 0,
    "action": "cluster:admin/rradmin/refreshsettings",
    "block": "{ name: 'ADMIN_GRP', policy: ALLOW, rules: [groups,kibana_access]",
    "id": "648726225-1470723316#5383",
    "content_len": 0,
    "user": "admin"
-
Is there any other fields you would like ROR to ingest by default?
-
Name a visualization you would see fit in the “Security Audit” dashboard (i.e. Bar chart: x=time, y= # of failed authentication)
-
Name a visualization yould see fit in the "Performance Audit" dashboard (i.e. Pie chart: users that consumed most processing time today)
-
Any other use case we should cover apart from Security & Performance?
Thank you!