I get ROR login screen, so that’s OK. But then, when I log in to kibana via ROR, I get redirected to the default
http://kibana_http_address/spaces/space_selector
When I use again(being already logged in) the same(above) link for “search query“, I get redirected correctly to expected results in specific kibana space.
Were there any changes between versions <1.69.1 - 1.70.3> in this “area”?
Additionally I see these logs in kibana.log file after I log in:
[info][plugins][ReadonlyREST][authController][x-ror-correlation-id=XXXX] Refreshing session against ES
[ERROR][http] 400 Bad Request
[warning][plugins][ReadonlyREST][authController][x-ror-correlation-id=YYYY] Blocked nextUrl with control/whitespace bytes: /kibana_instance_name/s/space_name/app/discover#/?_g=(refreshInterval:(pause:!t,value:0),time:(from:'2026-07-23T08:16:21.850Z',to:'2026-07-23T14:16:21.850Z'))&_a=(columns:!(X,Y,Z),dataSource:(dataViewId:'XXXX',type:dataView),filters:!(),interval:'5m',query:(language:kuery,query:'event.type: error'),sort:!(!('@timestamp',desc)))#/?_g=(refreshInterval:(pause:!t,value:0),time:(from:'2026-07-23T08:16:21.850Z',to:'2026-07-23T14:16:21.850Z'))&_a=(columns:!(X,Y,Z),dataSource:(dataViewId:'XXXX',type:dataView),filters:!(),interval:'5m',query:(language:kuery,query:'event.type: error'),sort:!(!('@timestamp',desc)))
[WARN ][plugins.security.routes] Cannot record authentication type: current user could not be retrieved.
+ sometimes
[ERROR][savedobjects-service.repository.point-in-time-finder] Failed to open PIT for types [tag]
Sorry for the delay; I didn’t have a chance to take a look at it yet. I will get back to this topic at the beginning of next week and provide a pre-release build with a fix.
[warning][plugins][ReadonlyREST][userMetadataValidator][x-ror-correlation-id=XXXXXXXX-XdXX-XXXc-XeXf-bfXXXc6bXXXX] User "XXX" has kibana.index ".kibana" configured, but the multi-tenancy feature is not available (requires an Enterprise license and multiTenancyEnabled config) — kibana.index will be ignored.
with every user logged in kibana after upgrade. Are these expected?
In neither kibana config nor ROR config, I do not use ‘kibana.index’. Maybe only in ror block with indices: [“.kibana-*”]
with every user logged in kibana after upgrade. Are these expected?
No, the message should be shown only in case of kibana related index rule definition in the ACL. We identified a problem. I will prepare a fix accordingly and send you a pre-release build.
and before I see any values, I get these “warning” message in kibana logs
[info][plugins][ReadonlyREST][KibanaErrorInterceptor][x-ror-correlation-id=bXdeXXXd-XXfe-XXcX-XaeX-XXaff0Xb4cXX] Receiving 500 error from Kibana response with a data: {"statusCode":500,"error":"Internal Server Error","message":"Cannot read properties of undefined (reading 'read')"}, from url: /s/kibana_space/internal/fields_metadata?attributes=description%2Ctype&fieldNames=environment and requested from address: http://kibana_ip/kibana_instance/s/kibana_space/app/discover
*for every ‘/internal/fields_metadata?attributes=description%2Ctype&fieldNames={field}’ where “{field}” is the ‘available’ field to choose in kibana.
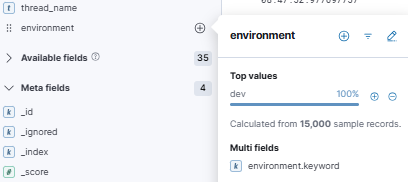
When being in Discover Tab, I click on available fields to see “Top values”
and before I see any values, I get these “warning” message in kibana logs
[info][plugins][ReadonlyREST][KibanaErrorInterceptor][x-ror-correlation-id=bXdeXXXd-XXfe-XXcX-XaeX-XXaff0Xb4cXX] Receiving 500 error from Kibana response with a data: {"statusCode":500,"error":"Internal Server Error","message":"Cannot read properties of undefined (reading 'read')"}, from url: /s/kibana_space/internal/fields_metadata?attributes=description%2Ctype&fieldNames=environment and requested from address: http://kibana_ip/kibana_instance/s/kibana_space/app/discover
*for every ‘/internal/fields_metadata?attributes=description%2Ctype&fieldNames={field}’ where “{field}” is the ‘available’ field to choose in kibana.
I couldn’t reproduce this warning on my side. Could you provide an ACL block from the readonlyrest.yml settings where this behaviour happens?
Using ROR 1.70.3_es8.19.7 I don’t see that error but in Browser Devtools there are for example
Request URL http://kibana_ip/kibana_instance/s/kibana_space/internal/fields_metadata?attributes=description%2Ctype&fieldNames=APP_NAME
Request Method GET
Status Code 500 Internal Server Error
I was able to reproduce the issue by disabling fleet in the kibana.yml settings xpack.fleet.enabled: false. The 500 error is not produced by the plugin; we only log what the plugin received from Kibana. I checked this behaviour in a vanilla Kibana without ReadonlyREST plugins, and the behaviour is the same.
Using ROR 1.70.3_es8.19.7 I don’t see that error but in Browser Devtools there are for example
That’s strange because the logic to display this message didn’t change bewteen version, so in both versions you should see:
I can confirm, I have ‘xpack.fleet.enabled: false’ in kibana config file
I’ve also found that I see these messages in log only when I run kibana ‘locally’, not as a systemd service. Thus that kind of explains why I didn’t catch them earlier.