Hi,
We are now running ROR 1.70.1 with Elasticsearch and Kibana 9.4.2.
It seems users with
kibana_access: "ro"
Can no longer display TSVB visualizations.
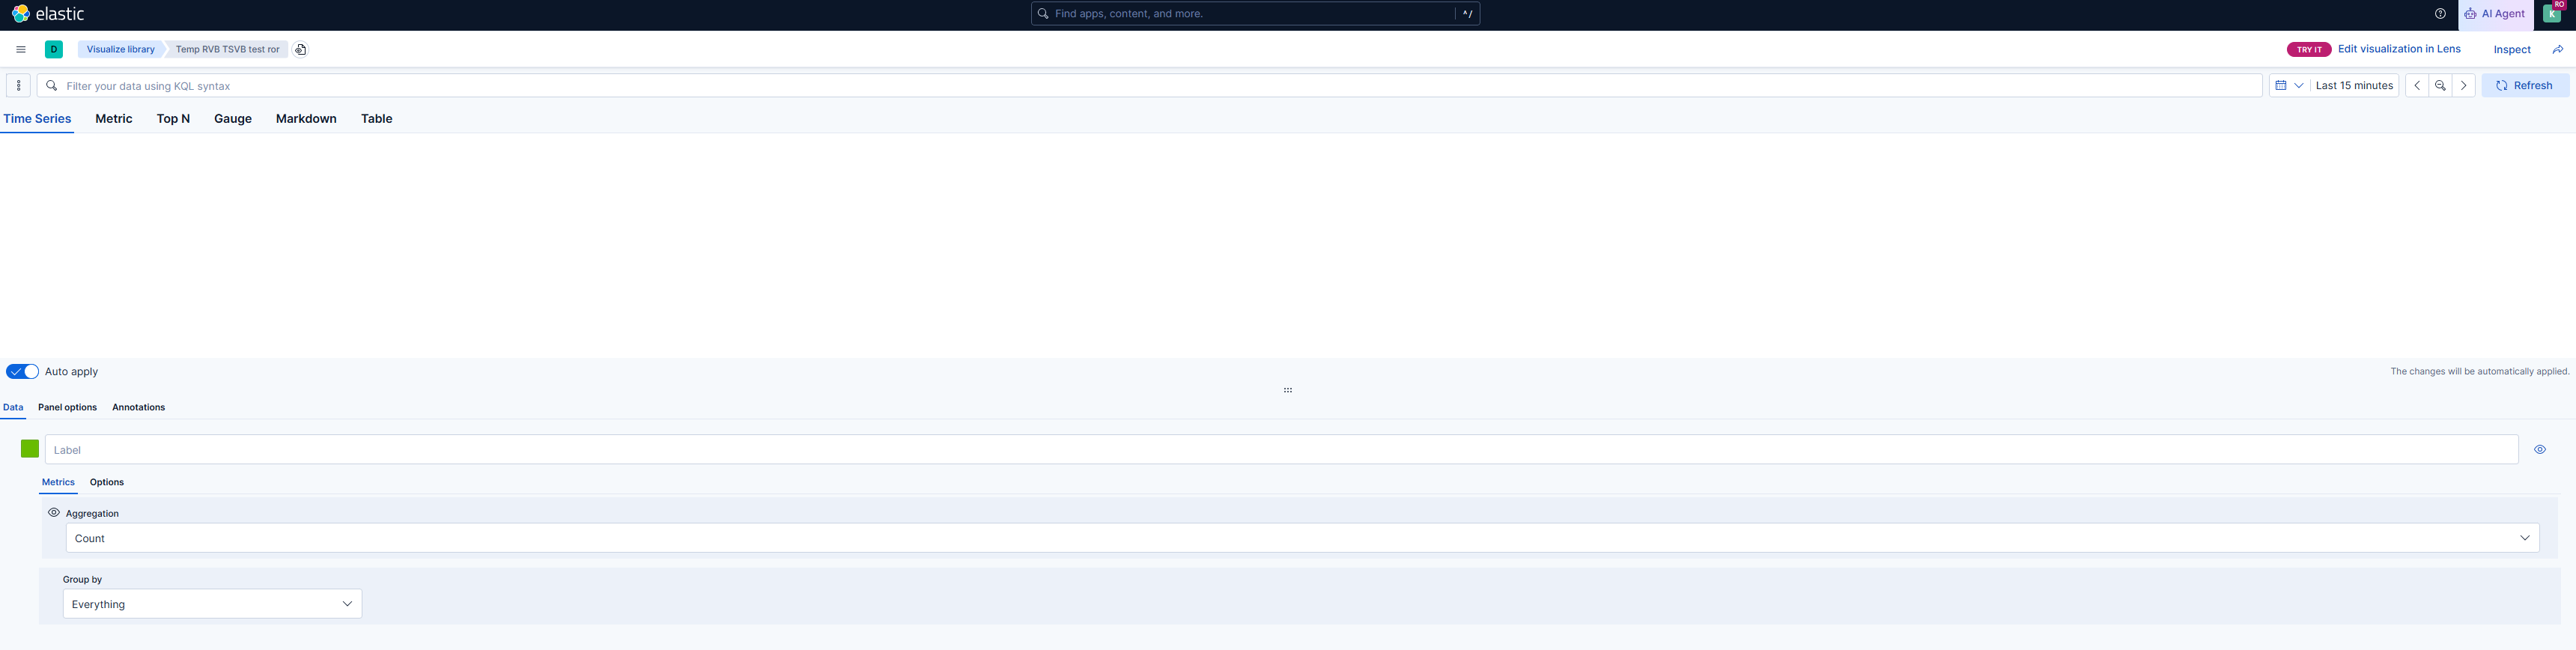
The graph remains empty. rw and admin users face no issues. Only ro.
We tried on 2 environments, both face this issue.
As far as we can tell the requests doesn’t show up in ROR audit logs.
We enabled debug on Kibana and saw:
Blocked nextUrl with control/whitespace bytes: /s/default/app/visualize#/edit/990b10a2-ddc6-4ebb-a326-5a3511381b02?_g=(filters:!(),refreshInterval:(pause:!t,value:60000),time:(from:now-15m,to:now))&_a=(filters:!(),linked:!f,query:(language:kuery,query:''),uiState:(),vis:(aggs:!(),params:(axis_formatter:number,axis_position:left,axis_scale:normal,drop_last_bucket:0,id:'9589bc0e-5e2f-4107-8063-6c6bb866e0f8',index_pattern:(id:b878e66b-25ac-456a-b85e-696ec3bc0493),interval:'',isModelInvalid:!f,max_lines_legend:1,series:!((axis_position:right,chart_type:line,color:#68BC00,fill:0.5,formatter:default,id:'28ff4d9e-c13e-44e0-ba92-a7c5f0ea983a',line_width:1,metrics:!((id:'52a28ff0-18b2-41c6-ae08-cab5303549cd',type:count)),override_index_pattern:0,palette:(name:default,type:palette),point_size:1,separate_axis:0,series_drop_last_bucket:0,split_mode:everything,stacked:none,time_range_mode:entire_time_range)),show_grid:1,show_legend:1,time_field:'',time_range_mode:entire_time_range,tooltip_mode:show_all,truncate_legend:1,type:timeseries,use_kibana_indexes:!t),title:'Temp RVB TSVB test ror',type:metrics))
But no further loggings, in Kibana log.
The response to the HTTP request is:
Request URL:
https://kibanaurl/s/default/internal/metrics/vis/data
{
    "9589bc0e-5e2f-4107-8063-6c6bb866e0f8": {
        "id": "9589bc0e-5e2f-4107-8063-6c6bb866e0f8",
        "error": "Could not find the data view: b878e66b-25ac-456a-b85e-696ec3bc0493",
        "series": []
    }
}
The mentioned data view does exist.
The moment we switch permissions to rw, the issue is resolved.
All worked on ROR 1.69.1 with Elasticsearch/Kibana 9.1.5.
As we only found this issue on production, this broke some dashboards for our users.
A quick remediation would be great.