tbhaxor
April 28, 2020, 4:29am
1
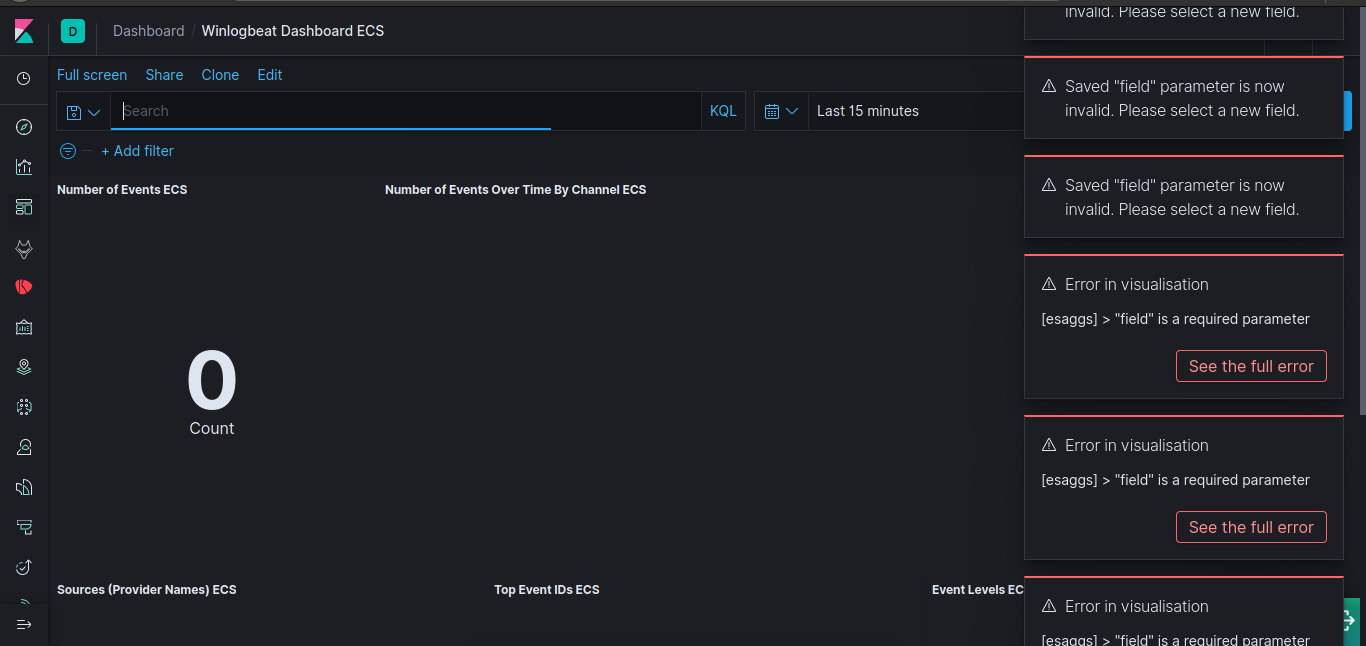
The correct procedure is given on documentation, after i followed it, i have created dashboard, but the new problem is coming while opening dashboard
[esaggs] > "field" is a required parameter
and
Error fetching fields for index pattern winlogbeat-* (ID: winlogbeat-*)
Wrapper@http://206.189.128.192:5601/bundles/commons.bundle.js:3:4453680
HttpFetchError@http://206.189.128.192:5601/bundles/commons.bundle.js:3:4455462
fetchResponse$@http://206.189.128.192:5601/bundles/commons.bundle.js:3:4451135
s@http://206.189.128.192:5601/bundles/kbn-ui-shared-deps/kbn-ui-shared-deps.js:338:774550
l/i._invoke</<@http://206.189.128.192:5601/bundles/kbn-ui-shared-deps/kbn-ui-shared-deps.js:338:774304
v/</e[t]@http://206.189.128.192:5601/bundles/kbn-ui-shared-deps/kbn-ui-shared-deps.js:338:774907
s@http://206.189.128.192:5601/bundles/kbn-ui-shared-deps/kbn-ui-shared-deps.js:338:774550
t@http://206.189.128.192:5601/bundles/kbn-ui-shared-deps/kbn-ui-shared-deps.js:338:775046
t/<@http://206.189.128.192:5601/bundles/kbn-ui-shared-deps/kbn-ui-shared-deps.js:338:775196
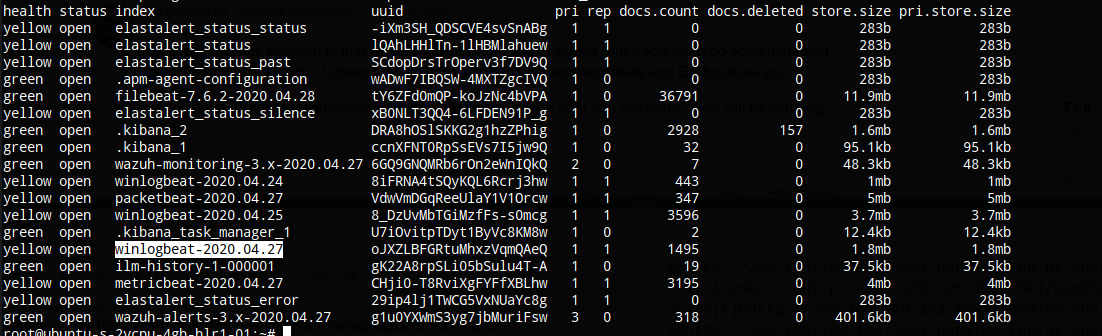
But index exists
It says this error in visualization. Since i am new to ELK stack, could you help me getting this solved?
sscarduzio
April 28, 2020, 10:56am
2
Please tail the log /var/log/elasticsearch/*log and try again getting that error in Kibana. You will probably see one or more log lines including the word “FORBIDDEN” plaste them here. Paste here also your YAML settings (readonlyrest.yml).
tbhaxor
April 28, 2020, 2:00pm
3
Since there were 11MB of logs (grepped with FORBIDDEN) so i have created a pastebin
Link: https://we.tl/t-ZqNdCphDW4
readonlyrest:
        access_control_rules:
                - name: "Require HTTP Basic Auth"
                  type: allow
                  auth_key: user:password
sscarduzio
April 28, 2020, 2:56pm
4
@tbhaxor if you are using our Kibana plugins, please follow our documentation page to have a minimum ACL configuration in place before starting using it.
tbhaxor
April 28, 2020, 3:19pm
5
@sscarduzio i tried using
actions: ["indices:data/read/*","indices:data/write/*","indices:admin/template/*","indices:admin/create"]
indices: ["logstash-*"]
with my existing readonly rest, like
readonlyrest:
        access_control_rules:
                - name: "Require HTTP Basic Auth"
                  type: allow
                  auth_key: user:password
                  actions: ["indices:data/read/*","indices:data/write/*","indices:admin/template/*","indices:admin/create"]
                  indices: ["logstash-*"]
The kibana status has been changes to red. See this PDF https://we.tl/t-ge0AgEo1NU
sscarduzio
April 28, 2020, 3:27pm
6
Yeah that won’t work for Kibana, it’s not that simple. A Kibana session has a lot of specific actions going on at different times and to different indices. We collected those in the macro rule “kibana_access” in purpose.
You can read how to use it here
tbhaxor
April 28, 2020, 6:03pm
7
I tried using all kibana_access
In all i am getting
sscarduzio
April 29, 2020, 10:17am
8
There is a Kibana bug about that message, there’s some workarounds but nobody really pin pointed a true solution.
opened 03:24PM - 20 Dec 16 UTC
closed 01:47PM - 15 Sep 18 UTC
bug
discuss
Team:Beats
Happening in master, using an imported packetbeat dashboard (imported via packet… beat 5.0)
<img width="1348" alt="screen shot 2016-12-20 at 10 21 24 am" src="https://cloud.githubusercontent.com/assets/16563603/21356011/2f510f78-c69e-11e6-9458-51e2946751fa.png">
Investigating...
However, as far as I understood your readonlyrest.yml looks like this:
But it still can’t work because you should allow the user to see its own “.kibana” index, so please change the indices rule to something like:
indices: ["logstash-*", ".kibana"]